-
-
October 25, 2023 at 7:07 am
JL Y
SubscriberThe picture on the left is the result of the literature reference, and the picture on the right is the result of my simulation. The first question is how to obtain the same range as the left picture for the color scale on the right after simulation. What impact does this range have on the result analysis? Why should the color scale value be processed as E/E0? The second question is how to draw a two-dimensional diagram of electric and magnetic fields like the one on the left?
-
October 26, 2023 at 9:05 am
Niki Papachristou
Ansys EmployeeHi JL Y,
Thank you for reaching out to us! You can edit the scale by clicking the pencil button on the visualizer window:
As you cans see on the picture above you can change from linear to log scale or change the axis limits. Regarding your questions: What impact does this range have on the result analysis? Why should the color scale value be processed as E/E0? I believe this depends on you and how you want to present your results. On how to draw a two-dimensional diagram of electric and magnetic fields like the one on the left? Please have a look on our article How to put a vector plot and mode field plot together from your MODE simulation.
I hope that was helpful, but feel free to reply if you have more questions.
Regards,
Niki
-
October 26, 2023 at 9:05 am
Niki Papachristou
Ansys EmployeeHi JL Y,
Thank you for reaching out to us! You can edit the scale by clicking the pencil button on the visualizer window:
As you can see on the picture above you can change from linear to log scale or change the axis limits. Regarding your questions: What impact does this range have on the result analysis? Why should the color scale value be processed as E/E0? I believe this depends on you and how you want to present your results. On how to draw a two-dimensional diagram of electric and magnetic fields like the one on the left? Please have a look on our article How to put a vector plot and mode field plot together from your MODE simulation.
I hope that was helpful, but feel free to reply if you have more questions.
Regards,
Niki
-
October 29, 2023 at 2:12 pm
JL Y
Subscriberload C:/Users/Neo/Desktop/y_1027.mat;x =lum.x;y =lum.y;A =lum.z;colormap jet ;x2 = linspace(min(x),max(x),701);y2 = linspace(min(y),max(y),519);[X,Y] = meshgrid(y,x);[X2, Y2] = meshgrid(y2,x2);A2 = interp2(X,Y,A,X2,Y2,'nearest');A3 = A2.';
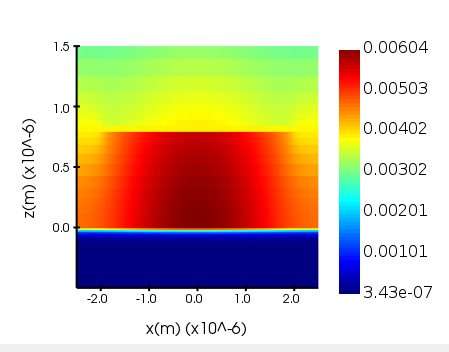
imagesc(x2, y2, real(A3));set(get(gca, 'XLabel'), 'String', 'x(m)')set(get(gca, 'XLabel'), 'FontSize', 16)set(get(gca, 'XLabel'), 'FontWeight', 'bold')set(get(gca, 'YLabel'), 'String', 'z(m)')set(get(gca, 'YLabel'), 'FontSize', 16)set(get(gca, 'YLabel'), 'FontWeight', 'bold')set(gca, 'XLim', [-2.5e-06 2.5e-06])set(gca, 'YLim', [-5e-07 1.5e-06])set(get(gca, 'Title'), 'String', '')set(get(gca, 'Title'), 'FontSize', 18)set(get(gca, 'Title'), 'FontWeight', 'bold')colorbar;set(gca, 'YDir','normal');
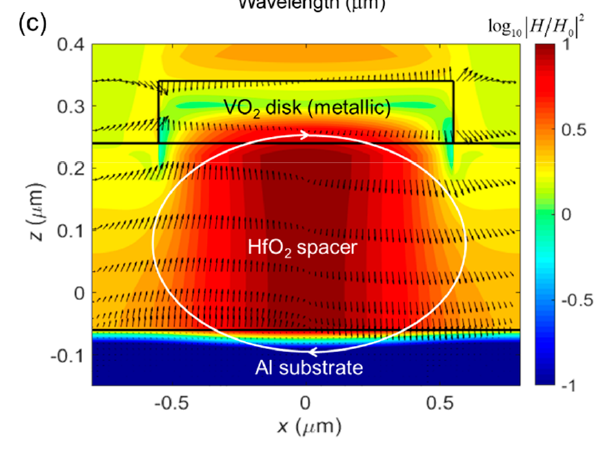
Thank you very much for the learning materials provided, but I still failed to get the expected result. The above code is my simulation result FDTD output of matlab to draw the magnetic field diagram code, may I ask how to combine with the electric field vector code linked by the example to draw my results -
October 30, 2023 at 7:38 am
Niki Papachristou
Ansys EmployeeHI JL Y,
I believe you have to experiment a little bit with the commands here. Based on the example above I think you might be missing the
hold on;
quiver(xmesh*1e6,zmesh*1e6,real(Ex2),real(Ez2)); % vector plot
commands for your respective parameters. -
November 1, 2023 at 12:56 pm
-
- The topic ‘How to map the distribution of magnetic and electric fields’ is closed to new replies.
-
3472
-
1057
-
1051
-
929
-
896
© 2025 Copyright ANSYS, Inc. All rights reserved.