-
-
September 14, 2024 at 12:21 am
w.k.sky.x
SubscriberI know we can do sweep parameters and map [the absorbance of gold nanoparticles] = f(diameter, wavelength).
but can we map the [Efield of gold nanoparticles] = f(diameter, wavelength).
For mapping, I am thinking the image similar to Fig. 2 in doi.org/10.1364/JOSAB.33.001075.
-
September 16, 2024 at 4:08 pm
Guilin Sun
Ansys EmployeeUnfortunately we do not have access to this paper. However, you can easily get the 2D map of the E field: since it is only a function of diameter and frequency, and you are sweeping the diameter, you only need a point monitor. Where to place this point monitor is up to you. It can be located at a specific point, which is the easiest way; you can also use a 3D monitor to get the max intensity inside the nanoparticle or including some outside region. Usually there is a "focus" spot with the highest intensity. To get this max intensity, you will need an analysis group, or inside the model, to use script to pickup the monitor data, eg
E2=getelectric("monitor_name");
E2max=max(E2);
and output the E2max from model or analysis group. Every sweep can directly extract this data E2max from model or analysis group. Therefore after sweep the diameter you will be able to get the 2D map of the max intensity. Note that this is not at one single position.
-
September 17, 2024 at 5:04 pm
w.k.sky.x
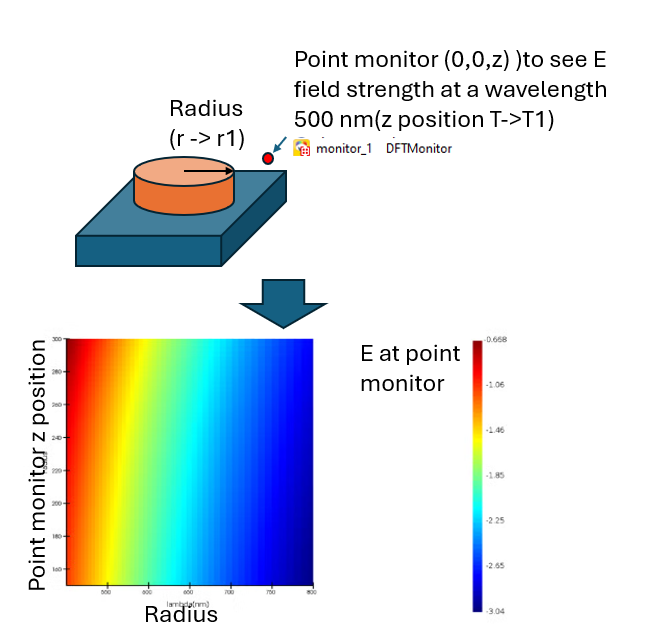
SubscriberThank you Guilin. I am trying to get the figure underneath similar to How to find out Phase shift of transmitted wave varying radius vs wavelength (ansys.com).
However, I am not sure how to export E field as a result in sweep. Should I use e-outlined or other analysis functions to export E strength? Thank you!
-------------------------------------------------
clear;
clc;# define the parameter
r = (1e-9)*10; #radius of structure 10 nm
T = (1e-9)*12; #E point monitor location 12 nmr1 = 16*(1e-9); #radius of structure 16 nm
T1 = (1e-9)*16; #E point monitor location 16 nmvalue1=3; # number of sweep points between r to r1 and T to T1
# add a new sweep and set basic properties
addsweep;
setsweep("sweep", "name", "sweep_pitch_script");
setsweep("sweep_pitch_script", "type", "Ranges");
setsweep("sweep_pitch_script", "number of points", value1);# define the parameter pitch
para1 = struct;
para1.Name = "radius";
para1.Parameter = "::model::Structure::radius";
para1.Type = "Length";
para1.Start = r;
para1.Stop = r1;
para1.Units = "nanometers";# add the parameter pitch to the sweep
addsweepparameter("sweep_pitch_script", para1);
# define the parameter pitch for point monitor location for E
para2 = struct;
para2.Name = "FDTD-monitor_1";
para2.Parameter = "::model::monitor_1::z";
para2.Type = "Length";
para2.Start = T;
para2.Stop = T1;
para2.Units = "nanometers";# add the parameter pitch to the sweep
addsweepparameter("sweep_pitch_script", para2);# define results
result_1 = struct;
result_1.Name = "E";
result_1.Result = "::model::monitor_1::E";# add the results R & T to the sweep
addsweepresult("sweep_pitch_script", result_1);# run the sweep
runsweep("sweep_pitch_script");# save & view the results
#mname="monitor_1"; # monitor name
#E=getdata(mname,"E");
#E2=getelectric("monitor_1");# mapping
X=1:para1;
Y=1:para2;
Z=1:result_1;
data=readmatrix(para1,para2,result_1);
dataset=rectilineardataset("dataset",para1,para2,results_1);
dataset.addattribute("data",data);
visualize(dataset);--------------------------------
-
September 19, 2024 at 11:36 pm
Guilin Sun
Ansys EmployeeRecently the forum does not send us email notifications for any post updates so I just found your new reply.
E field in a plane has a lot of data, and in order to get it from a sweep, you will first need to use fixed mesh size for the range of the radius change. make sure from min/max radius the field data has the same dimension. Then you can export it through sweep, the same as the point monitor. The only difference is, it has a lot of data, and it can slow your simulation and final data collection. The swept data will be at least 3D: xy (if it is in xy plane) and radius, for a fixed wavelength. If it is broadband, it will be 4D. Usually it is not necessary, since too much data cannot be viewed in one image. Please reconsider what is the most imortant data for you.
-
- You must be logged in to reply to this topic.


-
3402
-
1052
-
1051
-
896
-
877

© 2025 Copyright ANSYS, Inc. All rights reserved.


