Good morning
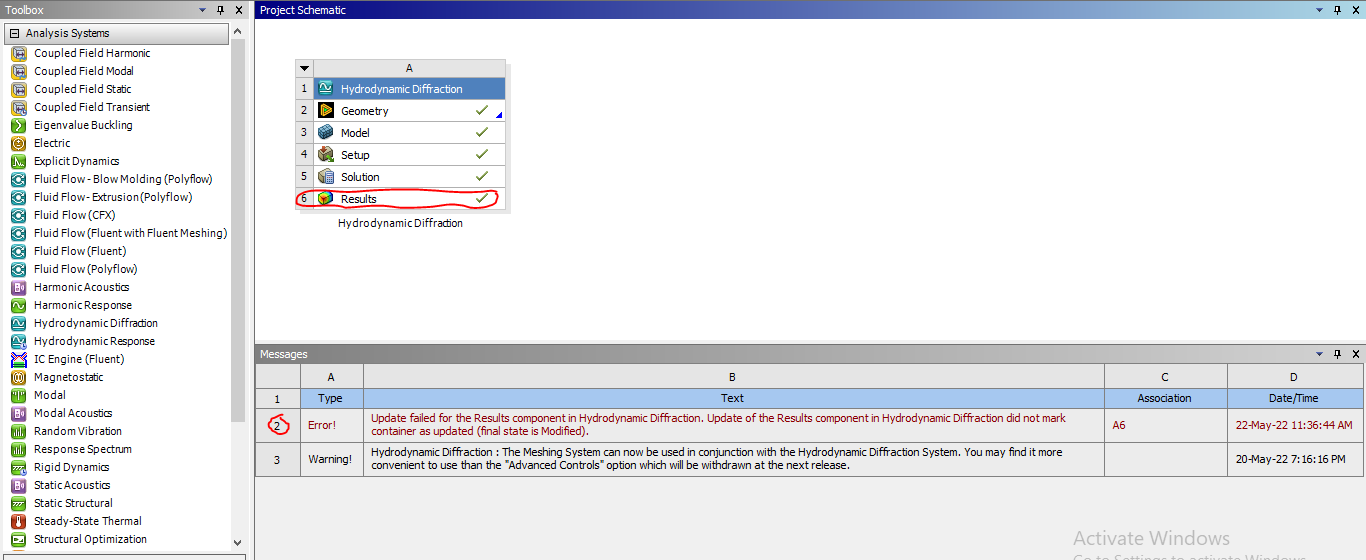
would it be possible to see the error message in the Aqwa Editor? Without this information, it is hard to tell what happens.
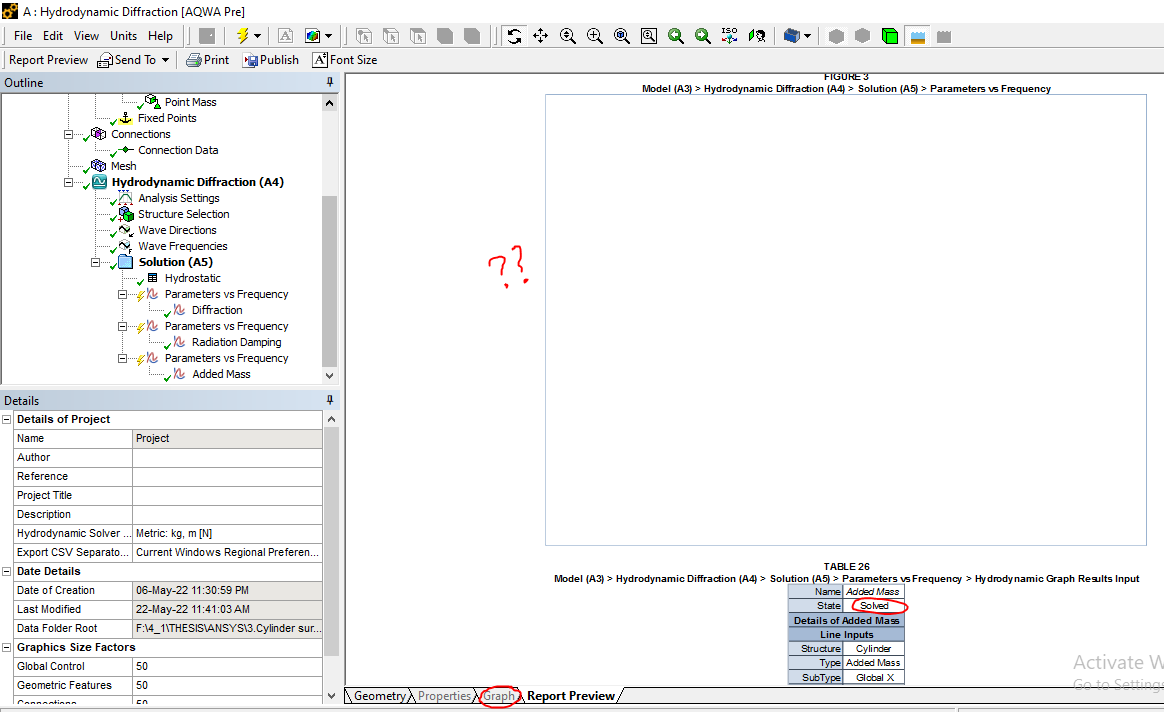
Also, it seems that none of your results are being evaluated as you still have yellow lights next to the "Parameter vs Frequency" and other graphs categories while you should have a green tick if the solve was completing without error and the results correctly evaluated. If you look at my screenshot, the Added Mass is correctly set and the Parameter vs Frequency is also correctly evaluated so I can see the plot ok.
Some points to check: make sure your geometry is correctly set:
cut at the water line,
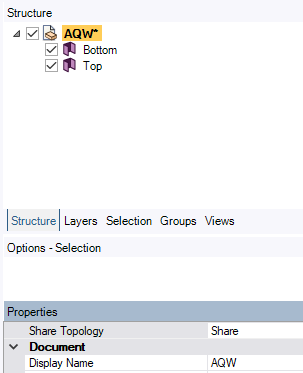
your geometry is only made out of surfaces and not a solid - You can open your geometry in SpaceClaim)
all the surfaces in your geometry have a Shared topology in SpaceClaim
One last thought.... depending on the output error you get, you might want to take a look at this discussion thread:
/forum/discussion/35144/plt-file-when-using-workbench-aqwa
I look forward to hearing from you.
Ingrid