

-
-
August 31, 2021 at 2:40 pm
jack6931470
SubscriberI need to get the green area on the graph
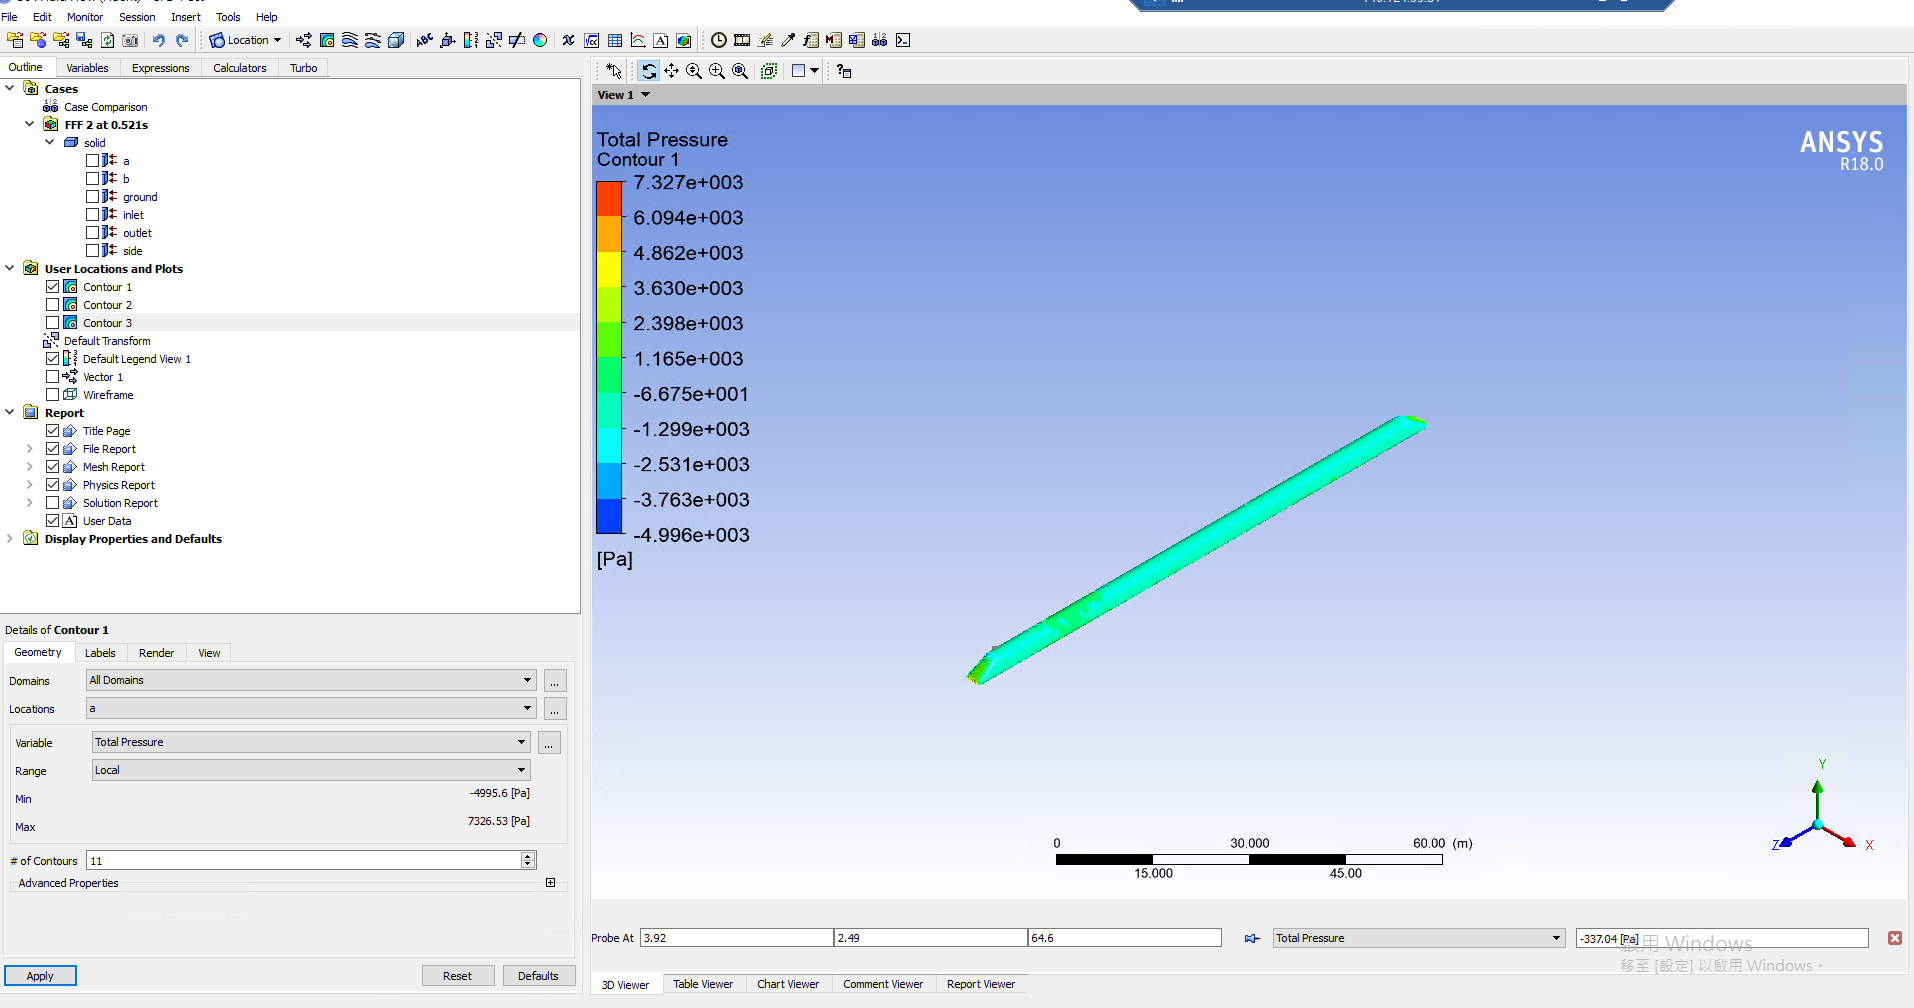
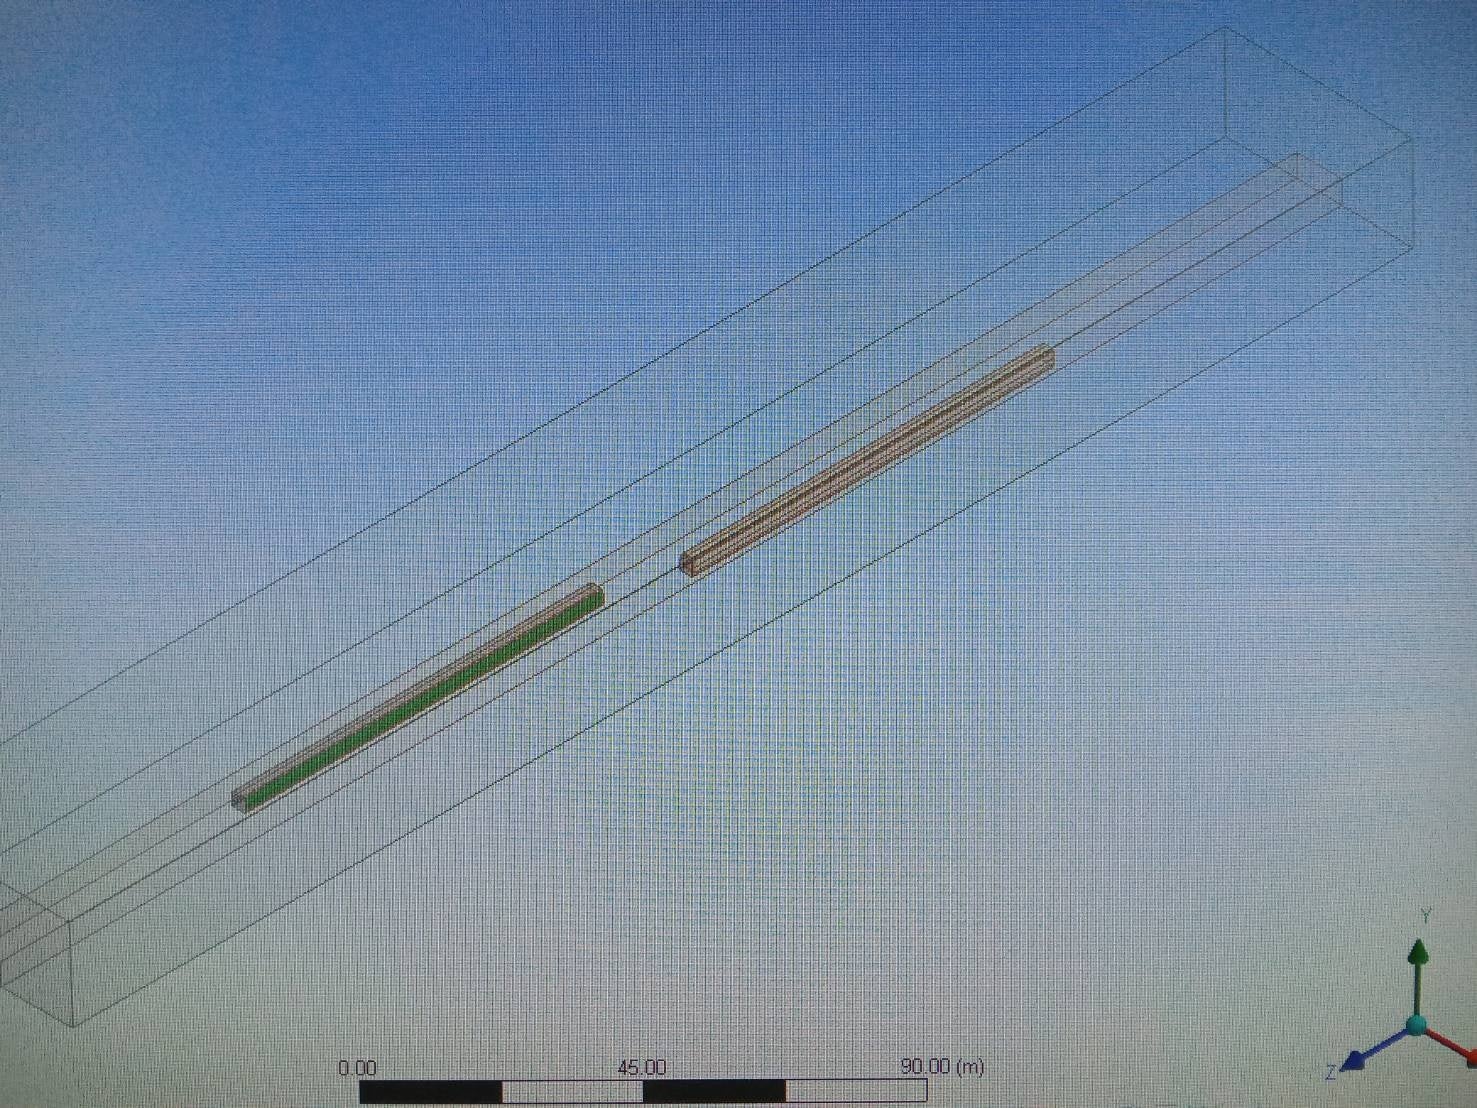
simulation goal:two trains pass each other in open air then Get the force on the bodyside flow area at the pass each other
I have calculation activites(mean Compressed file .gz files)
step:
project schematic:Fluid Flow(Fluent);in stepup :General(transient)
If any process is unclear, please let me know Thank you so much
September 1, 2021 at 1:14 pmKarthik Remella
AdministratorHello I'm not sure I understand your question. Are you trying to plot the force and you are unable to? If not, could you please clarify?
Karthik
September 1, 2021 at 1:17 pmAdministratorActually - I see your question was in the subject of this post.
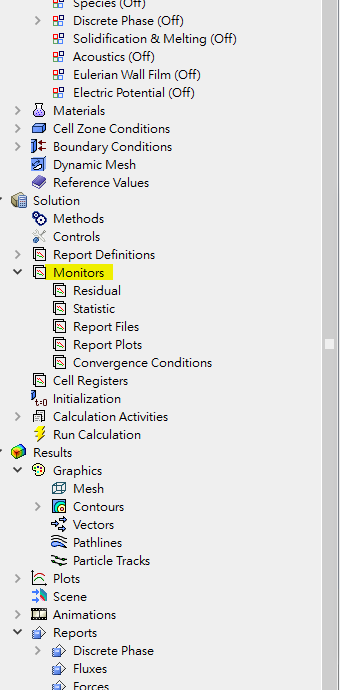
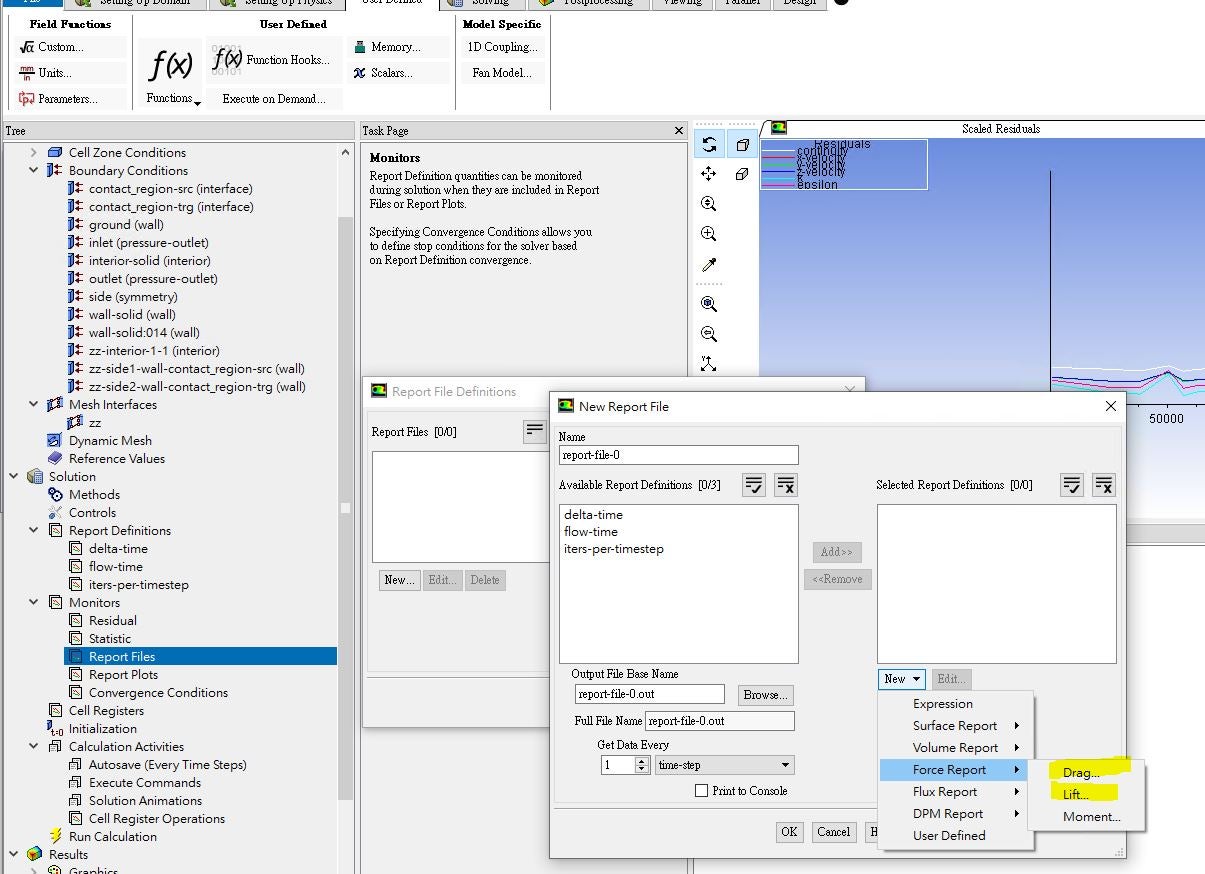
You should be able to create a Monitor for the force as a function of time.
Monitor -> Force Report ->
Karthik
September 1, 2021 at 1:41 pmSubscriber
Thank you for your answer
I rember your say about Monitor -> Force Report ->´╝îthis method need to set monitor point at observation ,first(ex:bottom graph)´╝îRight?
I need car side area all force´╝înot a monitor point force.
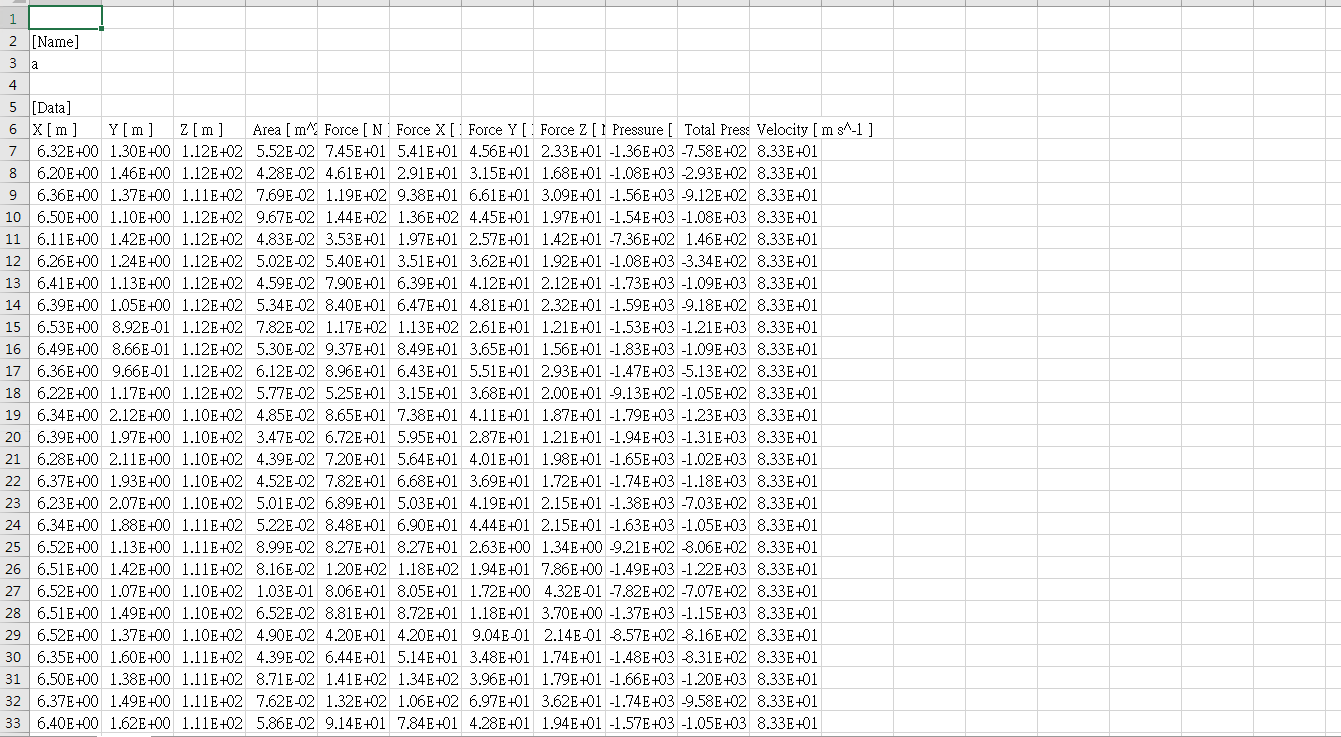
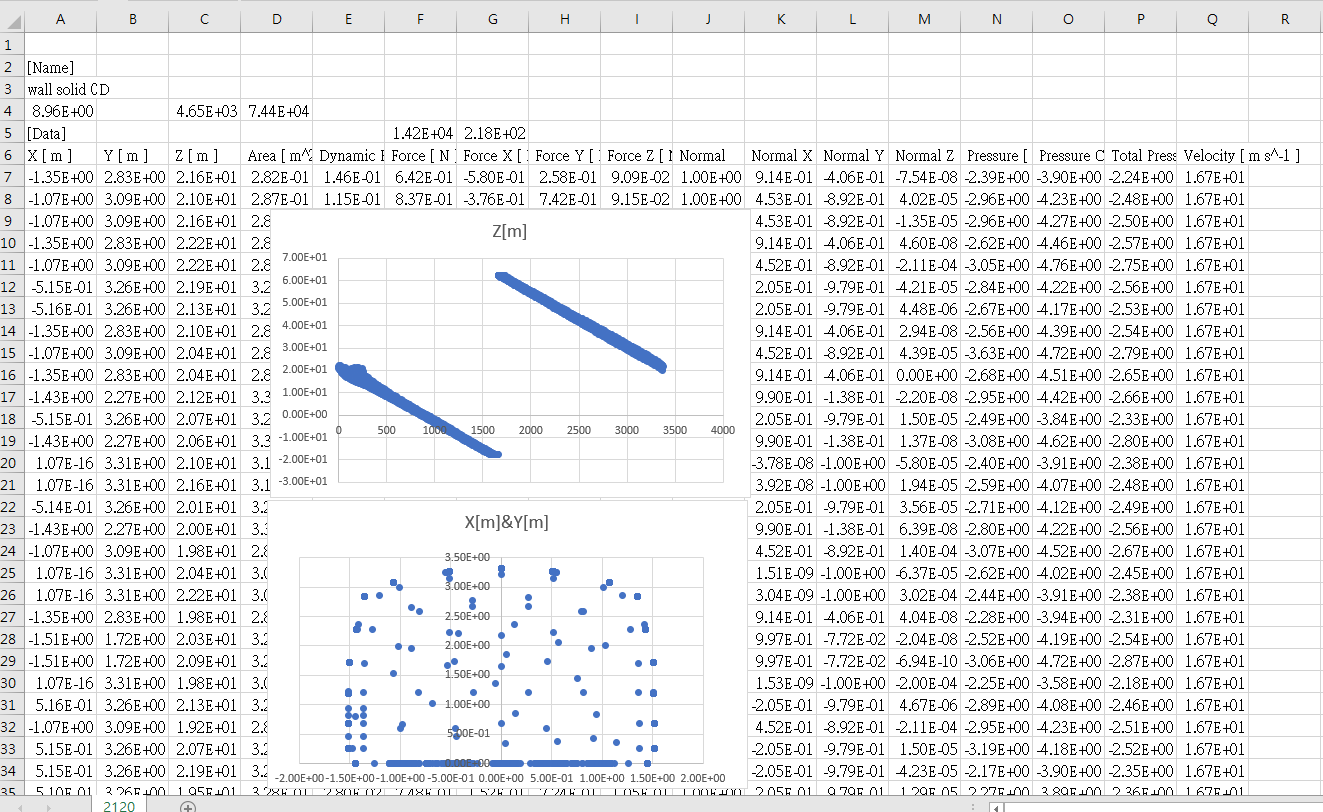
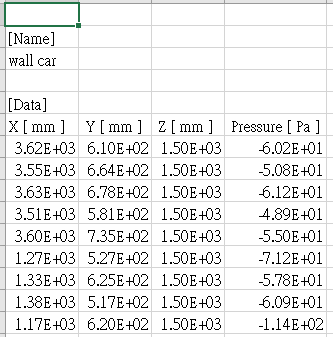
NOW´╝î I already finished simulation the will export to files(ex:graph 1) ´╝î but I am not sure this results are´╝îand I don't X[m}´╝îand I don't X[m]ÒÇüY[m]ÒÇüZ[m] ÒÇüForce[N] are mean what??
September 7, 2021 at 1:13 pmAdministratorHello,
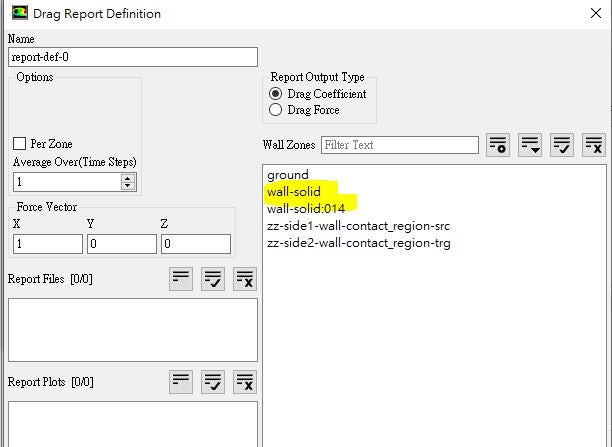
This is an older version. Right Click on 'Report Definitions' -> Force Report -> Force. Check if you are able to create a report this way. You will obtain just one single value of force (in the selected direction).
Karthik
September 18, 2021 at 7:25 amSubscriberSeptember 18, 2021 at 7:29 amSubscriberIs your method suitable for transients? I follow your method but no useful.or I don't understand your means.
September 20, 2021 at 10:24 amRob
Forum ModeratorIf you set up the monitor with time it'll give you an average force for the surface with time in the plot.
September 21, 2021 at 11:25 amSubscriberThank you so much!
After I set up a monitor, I can only get one point of pressure
But I need the pressure value on the side(Each grid) of the carbody.
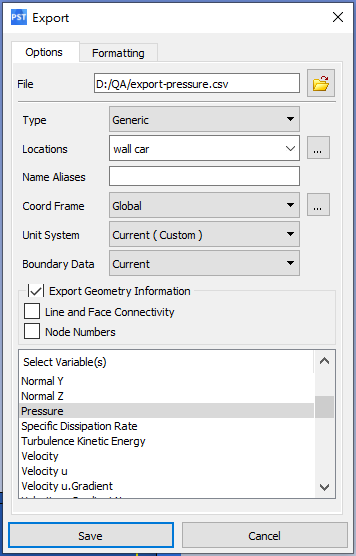
The attachment has the steps I set to get the pressure
also have some results data BUT I don't know X´╝øY´╝øZ-coordinate are mean from probe ?
Please tell me if it's correct?


September 21, 2021 at 12:12 pmSubscriberAnd the export data from CFD-Post. When I setup all some at two cases
And the train along Z axis movement but I have different results from CFD-Post.Then X´╝øY axis are same .
why??
September 21, 2021 at 12:40 pmForum ModeratorDo you want the pressure at every mesh point on the surface or the average of that value? The former will give you a curve, the latter gives you a lot of data to deal with elsewhere.
September 21, 2021 at 1:00 pmSubscriberI need the pressure at every mesh point on the surface
but I just need train body side no all train pressure.
how to get?
September 21, 2021 at 1:34 pmAdministratorHello If you are looking for pressure at every mesh point along the train surface, you are on the right track with the spreadsheet. You will need to figure out a way to reconstruct the train surface again on a 3rd party tool. Fluent will not order the data to form these surfaces. It is up to the user to rearrange the data to recreate the desired surfaces on the 3rd party tool.
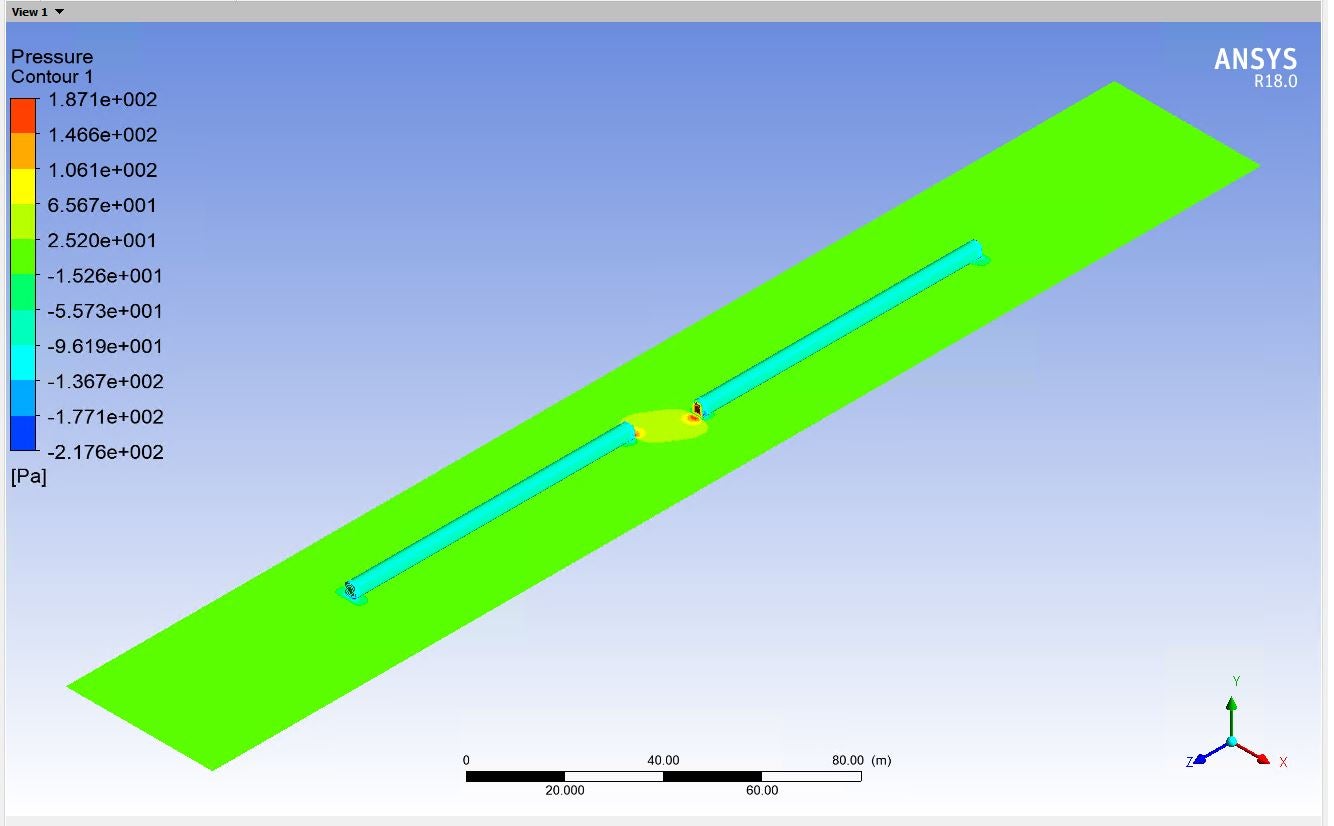
If you simply wish to visualize the data, you might want to plot the contour in Fluent. If you need data for additional analysis outside of Fluent, you are on the right track with the export solution. Unfortunately, you will need to figure the workflow on the 3rd party tool on your own.
Thank you.
Karthik
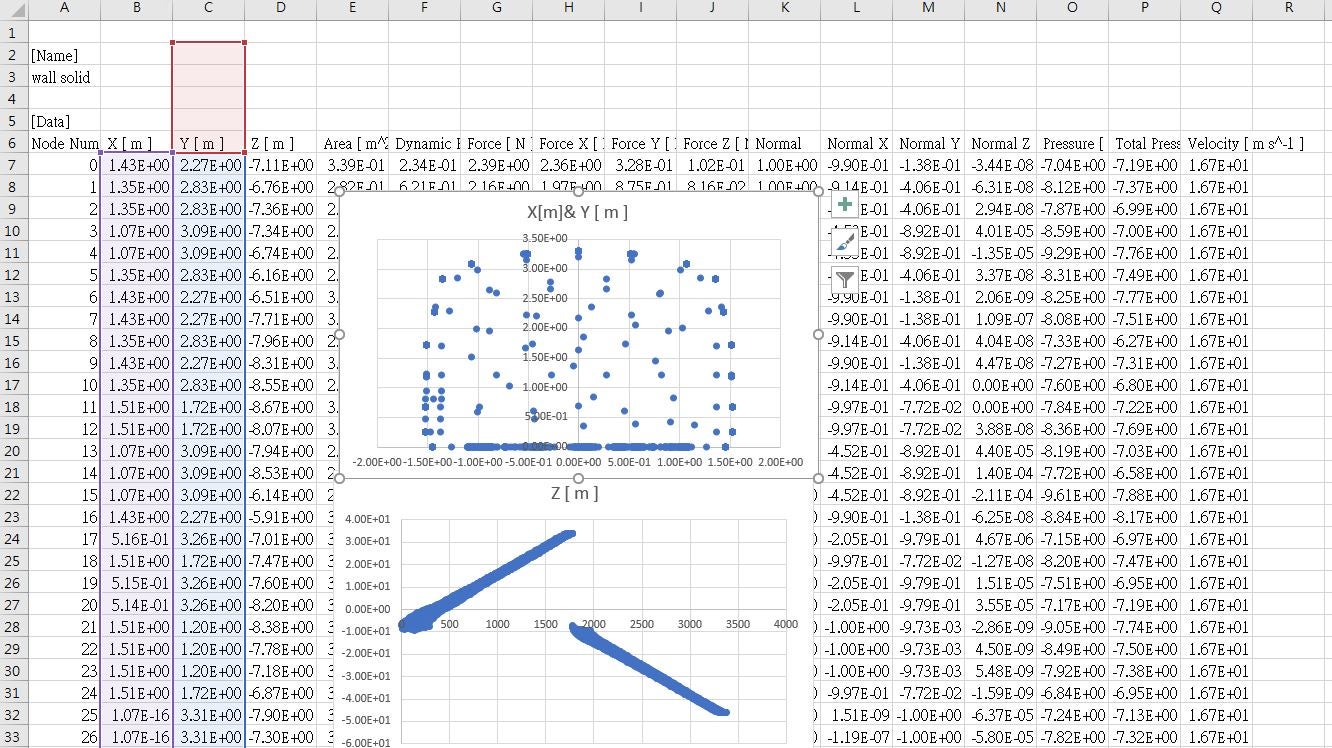
September 21, 2021 at 1:55 pmSubscriberCan't I export node or cell pressure results from CFD POST?(transient simulation)
e.g. appendix graph
September 21, 2021 at 1:57 pmAdministratorYou most definitely can! But, in order to recreate the surface in the 3rd party tool (such as Excel), you will need to rearrange the data. That's all!
Karthik
September 21, 2021 at 2:06 pmSubscriber


And the export data (excel). When I setup all some at two cases
And the train along Z axis movement but I have different results from CFD-Post.Then X´╝øY axis are almost same .
why??What do X[m]´╝øY[m]´╝øZ[m] mean here?
September 21, 2021 at 2:11 pmSubscriberX[m]´╝øY[m]´╝øZ[m] are imply zone coordinate?
Why results Z[m] are different at excel?(two cases set are same and also along Z axis moving)
September 24, 2021 at 1:36 pmAdministratorHello X, Y, and Z are the physical locations where you are asking CFD post to export your pressure data from. Are you showing the data for the different trains? If so, I would assume that the X, Y, and Z locations would be different.
Karthik
September 24, 2021 at 3:20 pmSubscriberI present the contour of a single train
So X,Y,Z refers to the coordinate point of the train contour in three-dimensional space?
September 27, 2021 at 10:41 amForum ModeratorEach node has a position, ie x, y and z.
Viewing 19 reply threads- The topic ‘How to export transient CFD pressure report?’ is closed to new replies.
Innovation Space Trending discussions
 Top Contributors
-
peteroznewman
 4803
4803 -
scabo
 1576
1576 -
Dennis Chen
 1386
1386 -
javat33489
 1242
1242 -
Shyam Prasad V Atri
1021
Top Rated Tags
© 2026 Copyright ANSYS, Inc. All rights reserved.
Ansys does not support the usage of unauthorized Ansys software. Please visit www.ansys.com to obtain an official distribution.
-


The Ansys Learning Forum is a public forum. You are prohibited from providing (i) information that is confidential to You, your employer, or any third party, (ii) Personal Data or individually identifiable health information, (iii) any information that is U.S. Government Classified, Controlled Unclassified Information, International Traffic in Arms Regulators (ITAR) or Export Administration Regulators (EAR) controlled or otherwise have been determined by the United States Government or by a foreign government to require protection against unauthorized disclosure for reasons of national security, or (iv) topics or information restricted by the People's Republic of China data protection and privacy laws.


