-
-
July 4, 2024 at 5:33 pm
Nurhalim Dwi Putra
SubscriberHello everyone,
I want to display a visualization using the pressure and motion wave contour display in Ansys AQWA HD, using several different photo results, but the max-min value in the legend remains the same in each photo result. How do I set it so that this value can be customized and not automatic? Where do I find it in the menu? Because currently the default menu is locked.
Â
Thanks
-
July 11, 2024 at 9:59 am
Mike Pettit
Ansys EmployeeHello,
I'm afraid there is no way to modify the min/max values in recent versions of Aqwa Workbench. I will try to get this fixed for the next release.
Mike
-
Viewing 1 reply thread
- The topic ‘
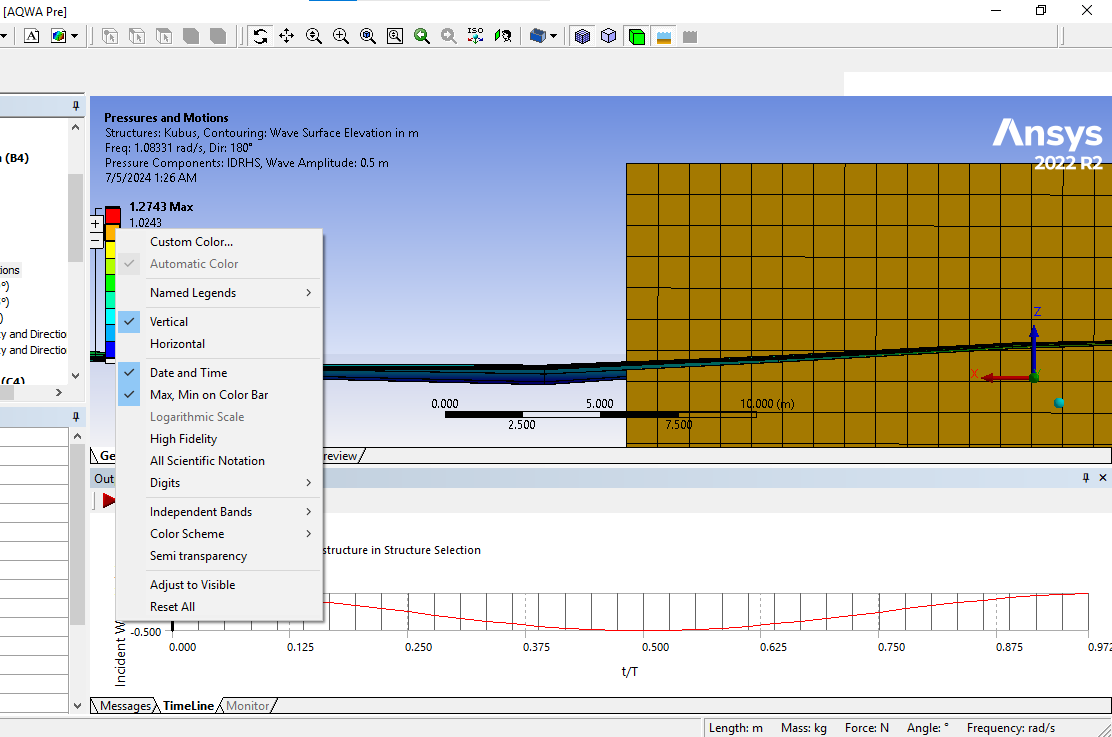
how to change the automatic value of the contour legend ANSYS AQWA HD’ is closed to new replies.
Ansys Innovation Space
Trending discussions
Top Contributors
-
3266
-
1031
-
1004
-
859
-
798
Top Rated Tags
© 2025 Copyright ANSYS, Inc. All rights reserved.
Ansys does not support the usage of unauthorized Ansys software. Please visit www.ansys.com to obtain an official distribution.