Hello and thank you for contacting us,
Lumerical does indeed calculate P as E x H* as mentioned in Integrating the Poynting Vector – Ansys Optics.
I used the following script to get P directly from a 2D monitor (named it P_lumerical), to calculate P from E and H fields from the monitor (named it P_calculated) and to calculate the magnitude as sqrt(Px^2+Py^2+Pz^2) (named it P_magnitude) and finally to visualize all three of them.
####################################################
mname="monitor";
E=getresult(mname,"E");
x=E.x;
y=E.y;
z=E.z;
f=E.f;
E=E.E;
H=getresult(mname,"H");
H=H.H;
P=getresult(mname,"P");
P=P.P;
Px=pinch(P,5,1);
Py=pinch(P,5,2);
Pz=pinch(P,5,3);
P_test=cross(E,conj(H));
Px_test=pinch(P_test,5,1);
Py_test=pinch(P_test,5,2);
Pz_test=pinch(P_test,5,3);
P_abs=sqrt(Px_test^2+Py_test^2+Pz_test^2);
P_lumerical = rectilineardataset("P_lumerical",x,y,z);
P_lumerical.addparameter("lambda",c/f,"f",f);
P_lumerical.addattribute("P_lum",Px,Py,Pz);
P_calculated = rectilineardataset("P_calculated",x,y,z);
P_calculated.addparameter("lambda",c/f,"f",f);
P_calculated.addattribute("P_calc",Px_test,Py_test,Pz_test);
P_magnitude = rectilineardataset("P_magnitude",x,y,z);
P_magnitude.addparameter("lambda",c/f,"f",f);
P_magnitude.addattribute("P_mag",P_abs);
visualize(P_lumerical);
visualize(P_calculated);
visualize(P_magnitude);
####################################################
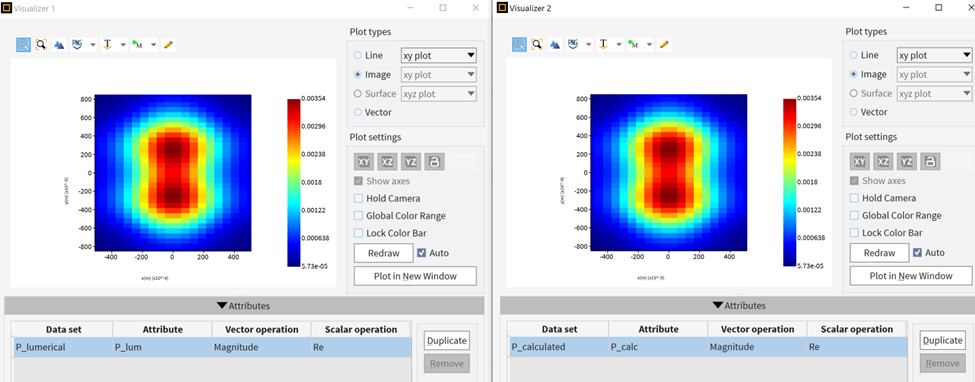
In my example the results where the same.
Below the magnitude of P_lumerical and P_calculated is plotted:
The x component (by choosing X in “Vector operation”) of P_lumerical and P_calculated:

I also get the same results for y and z components.
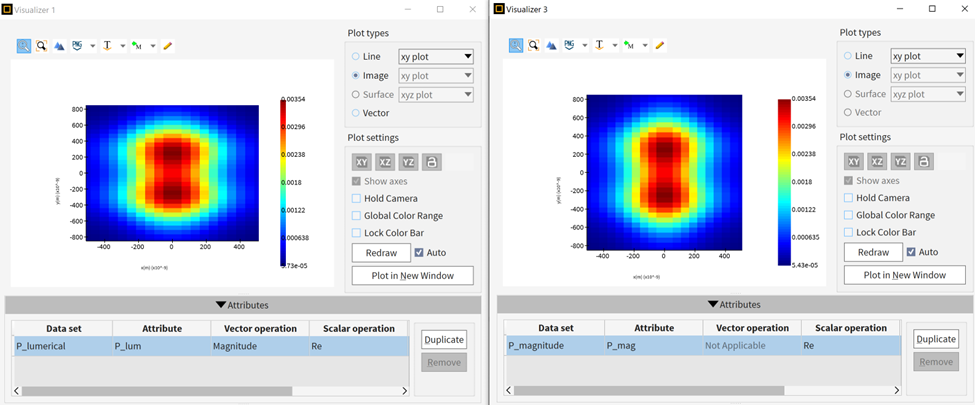
The magnitudes of P_lumerical and P_magnitude also match:
Could you please tell me if the script gives you the correct results (the monitor name in the first line needs to be updated)?
I remain at your disposal for any further information.
Best regards,
Afroditi


