

TAGGED: cfd-post, fluent, record-session
-
-
January 5, 2022 at 11:24 am
SickOfAnsys
SubscriberI'm trying to automate my CFD post processing as it is taking 20 minutes to produce a single transient velocity chart, I produce eight per simulation run, with eight pressure charts, eight vorticity charts and four pressure charts.
I saw a similar question below
Hi everyone!Perhaps you have an easy solution for my problem.
I created a chart (pressure vs X coordinate) along my user location 'line 1', which i saved into a csv file using the 'Export' button. However, because the simulations has of a number of (workbench) parameter variations i don't want to open every single post file to export this result manually.
Does anyone have an idea how to achieve this with 2020R1? Thx in advance!
January 6, 2022 at 9:44 amRob
Forum ModeratorAssuming you're using 2021R2 (and very soon 2022R1) you may find the reports and xy plots from Fluent to be quicker. Set up the first case, then set all the post processing lines etc and xy plots. Run the model & write out the plots (you can use journals but it's usually quicker to do it manually if you don't know how the TUI works). Save the case & data, then change the flow (or other setting) and re-run.
I do use journals in Fluent for post processing, but unless it's going to save hours it's quicker to use the Reports or just update & save the xy plots.
January 6, 2022 at 10:13 amSubscriberHi Rob. Thank you for your response.
I think I may need to use journals as I have been defining and producing the charts manually so far. I have set up the planes manually and then produced charts for the area average on these planes but not refreshing any of the charts until I've defined the last chart, then I select the checkbox for all charts. It took around 40 hours to produce the charts for one time-step. I simulated five different time steps sequentially and this took around the same length of time to just produce the first set of charts! I'm currently looking into a tutorial on how to create the journal file. I think I've done it correctly so may be able to import the post processing journal file for my other four cases, and just wait it out.
January 6, 2022 at 11:39 amForum ModeratorIt shouldn't take 40 hours to create the charts. We ran scripts to grab about 450 surface integrals & clip areas plus 40+ images in about 3-4 hours on 50M cells about 10-15 years ago. If you use the xy plots in Fluent and save each time step you'll have space delimited text to put into Excel.
January 6, 2022 at 12:29 pmSubscriberI don't understand why it is taking so long using CFD-Post
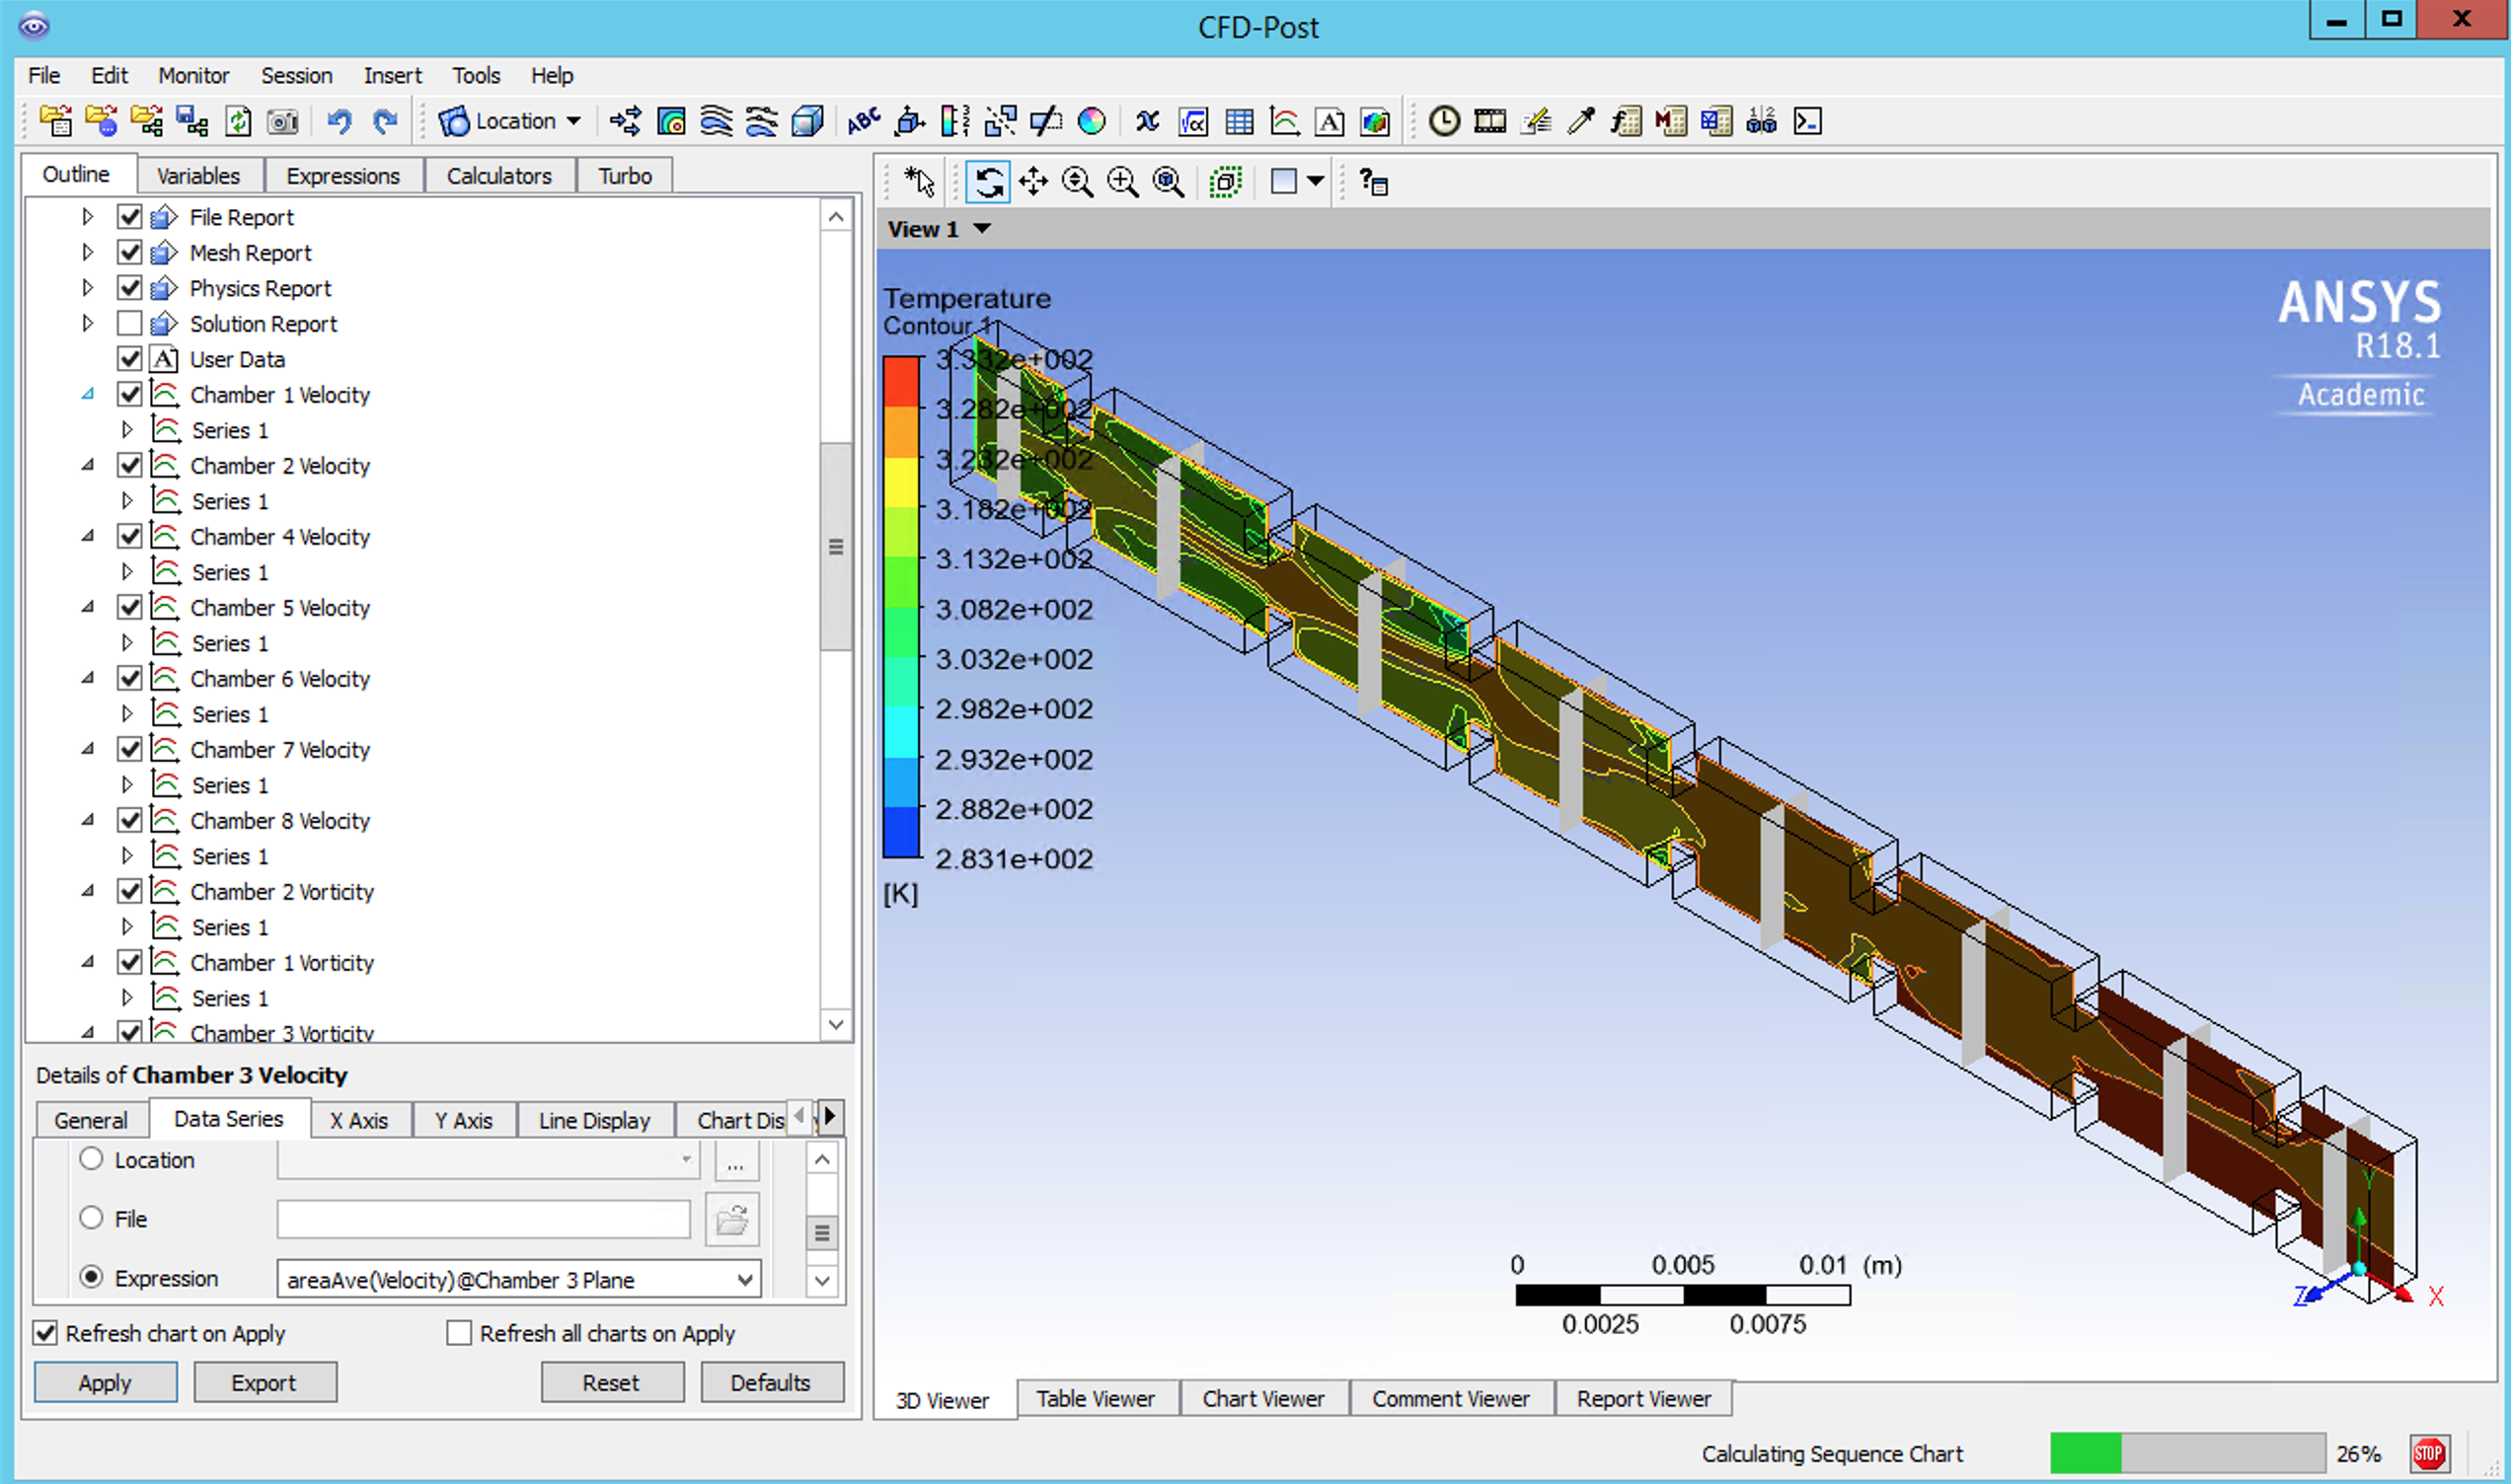 "Calculating Sequence Chart" is taking up to an hour for each chart, I then export the data manually to .csv files. I'm using "XY - Transient or Sequence" charts. When you say use xy charts in FLUENT, what is it that you mean? Is it more efficient to set up the xy charts in the setup, solution or results part of FLUENT?
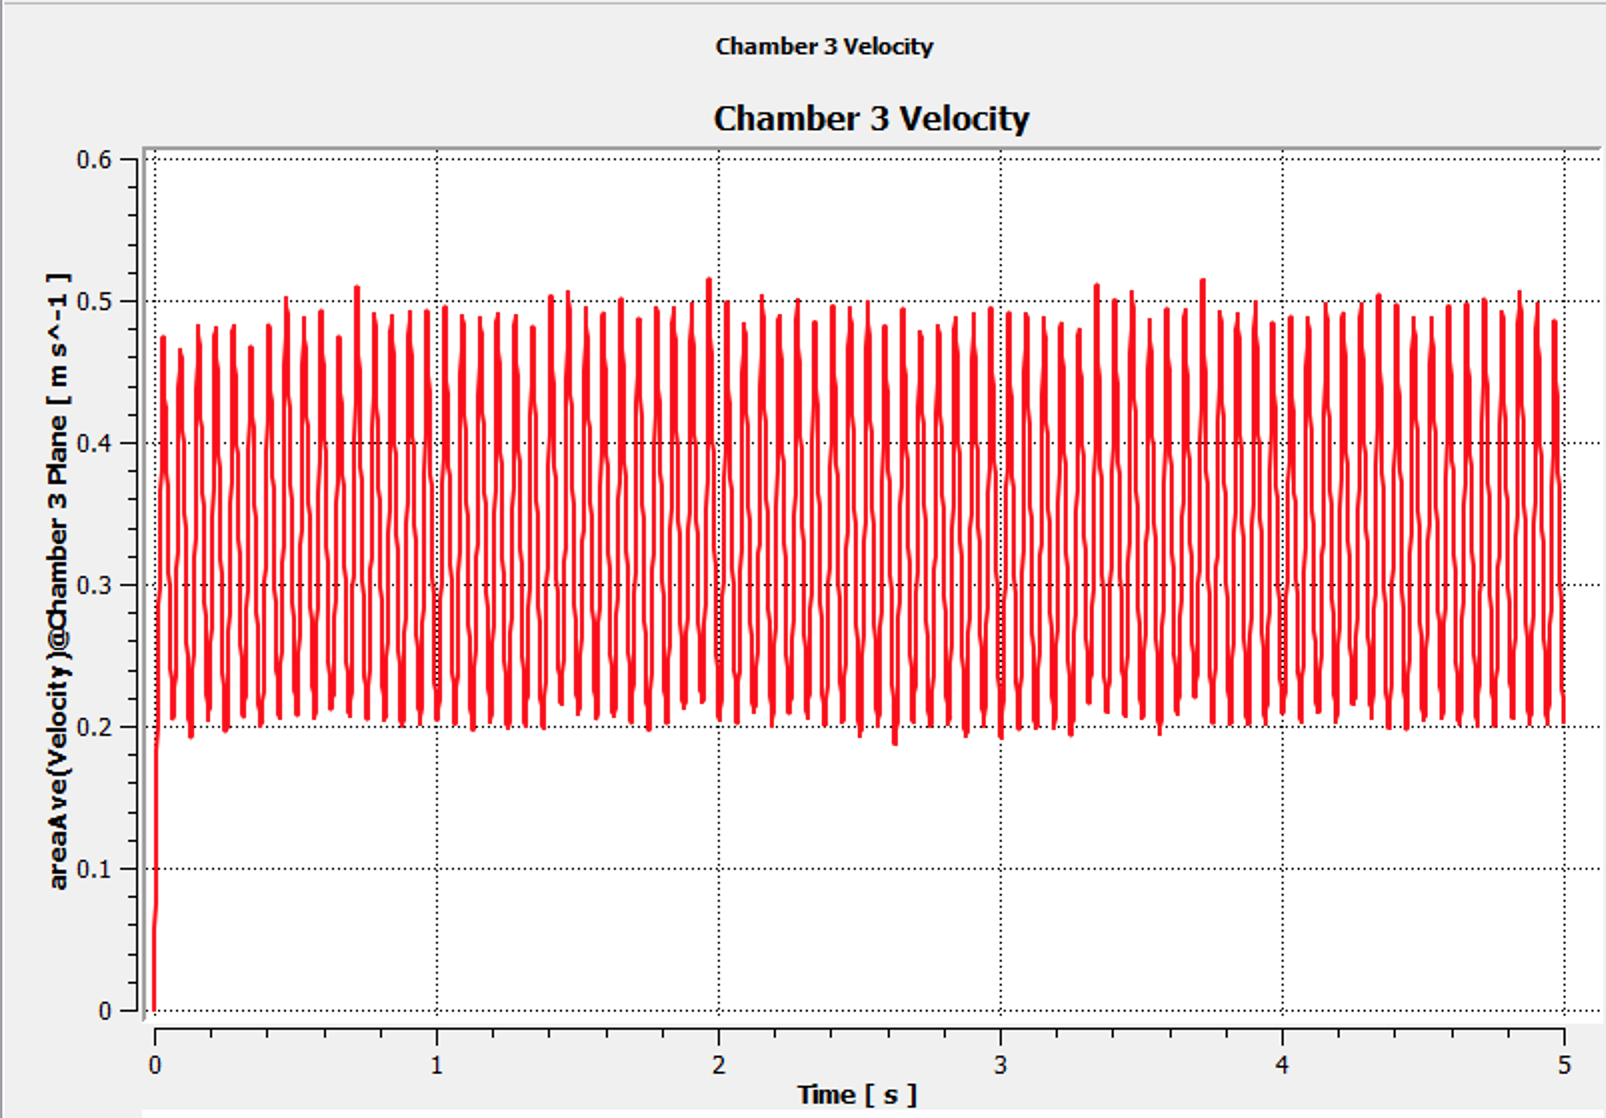
Then my charts are finally produced, this is how they look:
January 6, 2022 at 2:54 pmForum ModeratorHow big is the model? How much RAM is available?
January 6, 2022 at 5:16 pmSubscriberThe server that I use at work has 32 GB, and my personal computer (that crashed when producing the charts, prompted another question), has 64GB of RAM. The software is running on the server so I can't check the memory requirements of the mesh until it has finished, and I can't open the meshing program at all on my personal computer at the minute.
January 7, 2022 at 12:11 pmForum ModeratorHow many cells? CFD Post is a serial tool which is why we're back using the Fluent post processing, some of us didn't move to CFD Post when that was made available.
If you're creating those graphs from CFD Post, how many data files are you using? In Fluent we'd save that data during the run, CFD Post will need to extract the data from each file - that could explain the timings if you have several hundred data files.
January 7, 2022 at 12:40 pmSubscriber[EDIT]: I was not sure what you mean by "how big is the model", I was still typing this update and getting the files and links together when you published your response, but struggling through the Ansys user guide:
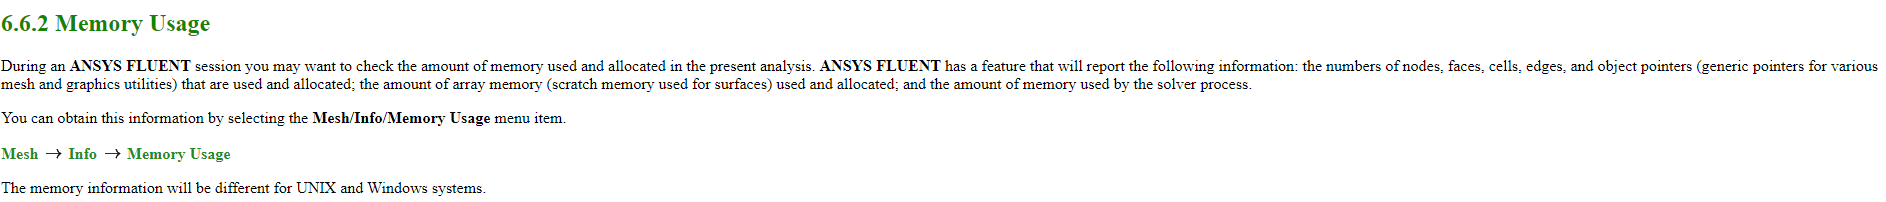 I (through trial and error), discovered that by "ANSYS FLUENT", they meant the Solution part of the program. Thanks to having to discover where the tabs were through trial and error, Ansys recognises that a change has occurred to the Mesh file (I did not change a thing, but searched for the mesh info). As a result my charts are gone.
I found another question when searching for a method for finding "how big is the model" is:
Now the response this person received was to "click on the Solution Information Folder". I have found where this is for Ansys Mechanical, but not for FLUENT.
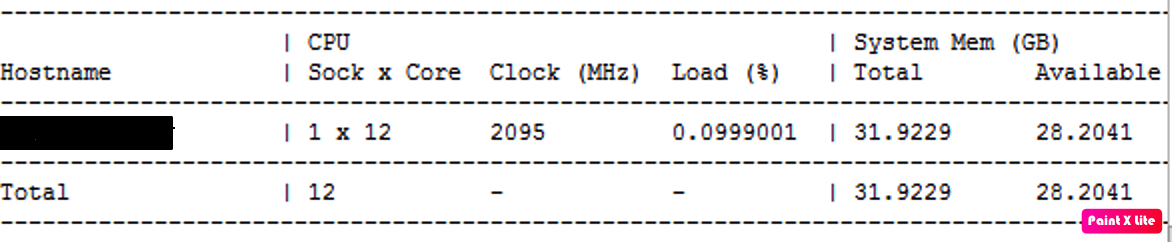
Typing "report/system/sys-stats" returns:
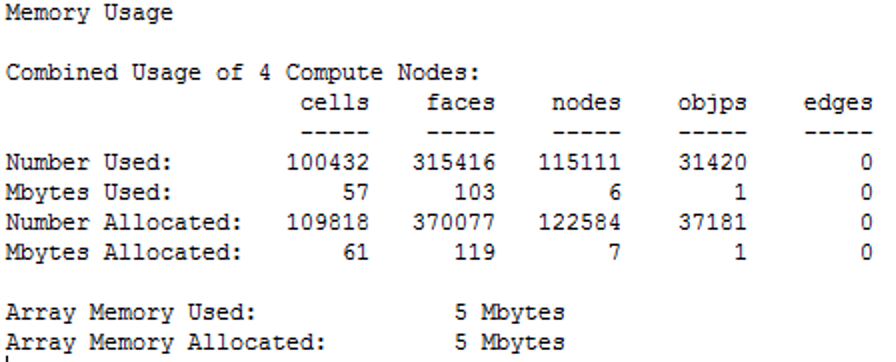
 Checking the Mesh Memory I get:
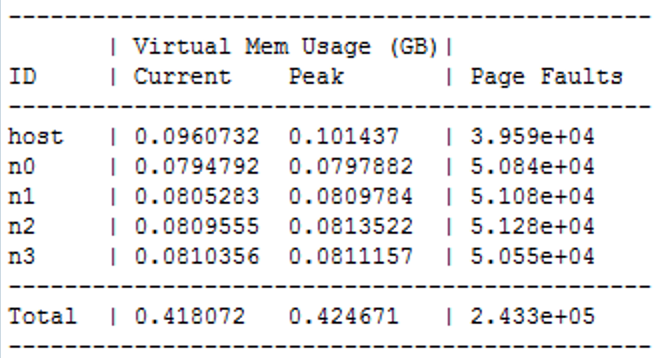
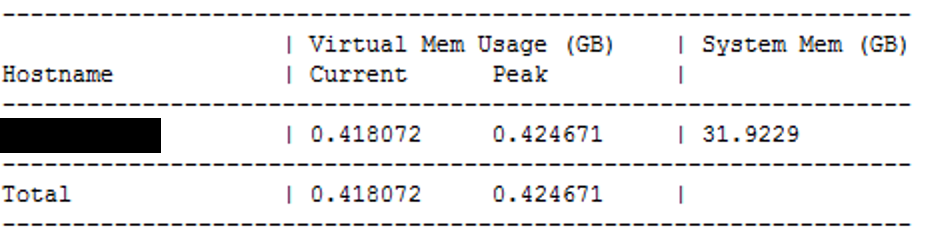
 And typing the "report/system/proc-stats" command I get:
 This information is all from the server. The number of cells were 98220 elements and 111440 nodes. So in future would you recommend producing the charts in Setup of Ansys Fluent (just referring to Ansys Fluent is too confusing as there are too many aspects of FLUENT, we have Geometry, Mesh, Setup and Solution).
For my personal machine I still can't recover the project following the crash. I've wasted an entire morning struggling through the User Guide and consulting semi-relevant forums to try to recover the project from files present within the dp0 folder. There should be an easily accessible section in the User Guide that explains how to do this, if there is; I can't find it as I do not have time to read a user manual that size, linearly; very few people do.
Thank you
January 7, 2022 at 2:22 pmForum ModeratorFluent is the solver, and there's also Fluent Meshing (formerly Tgrid), the other tools that you're using are part of Workbench. Whilst Workbench is very useful for parametric runs I tend to run Fluent in standalone mode as it simplifies the whole process and removes the whole DP0 issue.
January 7, 2022 at 3:04 pmSubscriberIs that run through flconsole? Have I lost my data from the previous crash?
I've run a new simulation (via workbench), for a Mesh independence study. I've used a journal file for the setup and have set up transient charts by following the methods present in the following video:
Fingers crossed once the simulation is complete I can extract the raw data.
January 7, 2022 at 3:27 pmForum ModeratorIf you read the pinned topic at the top of this section you'll find some instructions.
January 10, 2022 at 11:04 amSubscriberWhat and where is the pinned topic? I can't see anything "pinned", all I see is this:
 There are three item listed as "topics" here, and none of these are hyperlinks. I am asking a specific question of how to generate and extract data automatically using Ansys; not what models to use, or how to go about solving a complex flow program, just how do you extract the information efficiently using Ansys. I don't expect you to sit and type detailed instructions, but I would appreciate less vague directions of where to look. A hyperlink to a similar question or already available instructions for example, and actually answering my question when I ask if you access Fluent through flconsole! In the start menu there is no option for me to select to run Fluent as a standalone program, I found flconsole hidden in the fluent folder in my program files (keyword here is HIDDEN!).
The software should not be this difficult to actually make useful. The calculations and principles are complex and getting the software to interpret them and run them would understandably be laborious and intricate; but the collection, saving and transfer of the calculated data should be simple and intuitive! It makes absolutely no sense whatsoever for Ansys to be this unwieldy.
January 10, 2022 at 11:12 amJanuary 10, 2022 at 11:44 amSubscriberOkay, thanks for that; I had no idea that Fluent could be used as a standalone program and that the installer does not place a shortcut in the start menu.
However, if other users search for topics to search for tips on how to produce, save and manage their data produced by Ansys, the answer that they will get from this thread is:
"Fluent can be used outside of Workbench, but the installer makes this difficult to access; here is how it can be accessed".
January 10, 2022 at 11:54 amForum ModeratorTrue, but equally, rather than plotting all of the data after the run it's giving information to use monitors to get the curves during the run which is more efficient. State files will allow the repeat of the graph generation, but with the number of files you seem to have it's going to take time: using output monitors in Fluent will allow checks to be made during the simulation and avoid waiting for the graphs at the end.
Viewing 15 reply threads- The topic ‘How do you use the “record session” in CFD Post?’ is closed to new replies.
Innovation Space Trending discussions
 Top Contributors
-
peteroznewman
 5139
5139 -
scabo
 1831
1831 -
Dennis Chen
 1387
1387 -
javat33489
 1248
1248 -
Shyam Prasad V Atri
1021
Top Rated Tags
© 2026 Copyright ANSYS, Inc. All rights reserved.
Ansys does not support the usage of unauthorized Ansys software. Please visit www.ansys.com to obtain an official distribution.
-


