TAGGED: -waveguide, ansys-hfss, electric-field
-
-
August 26, 2023 at 7:37 am
Chi-Wei Lee
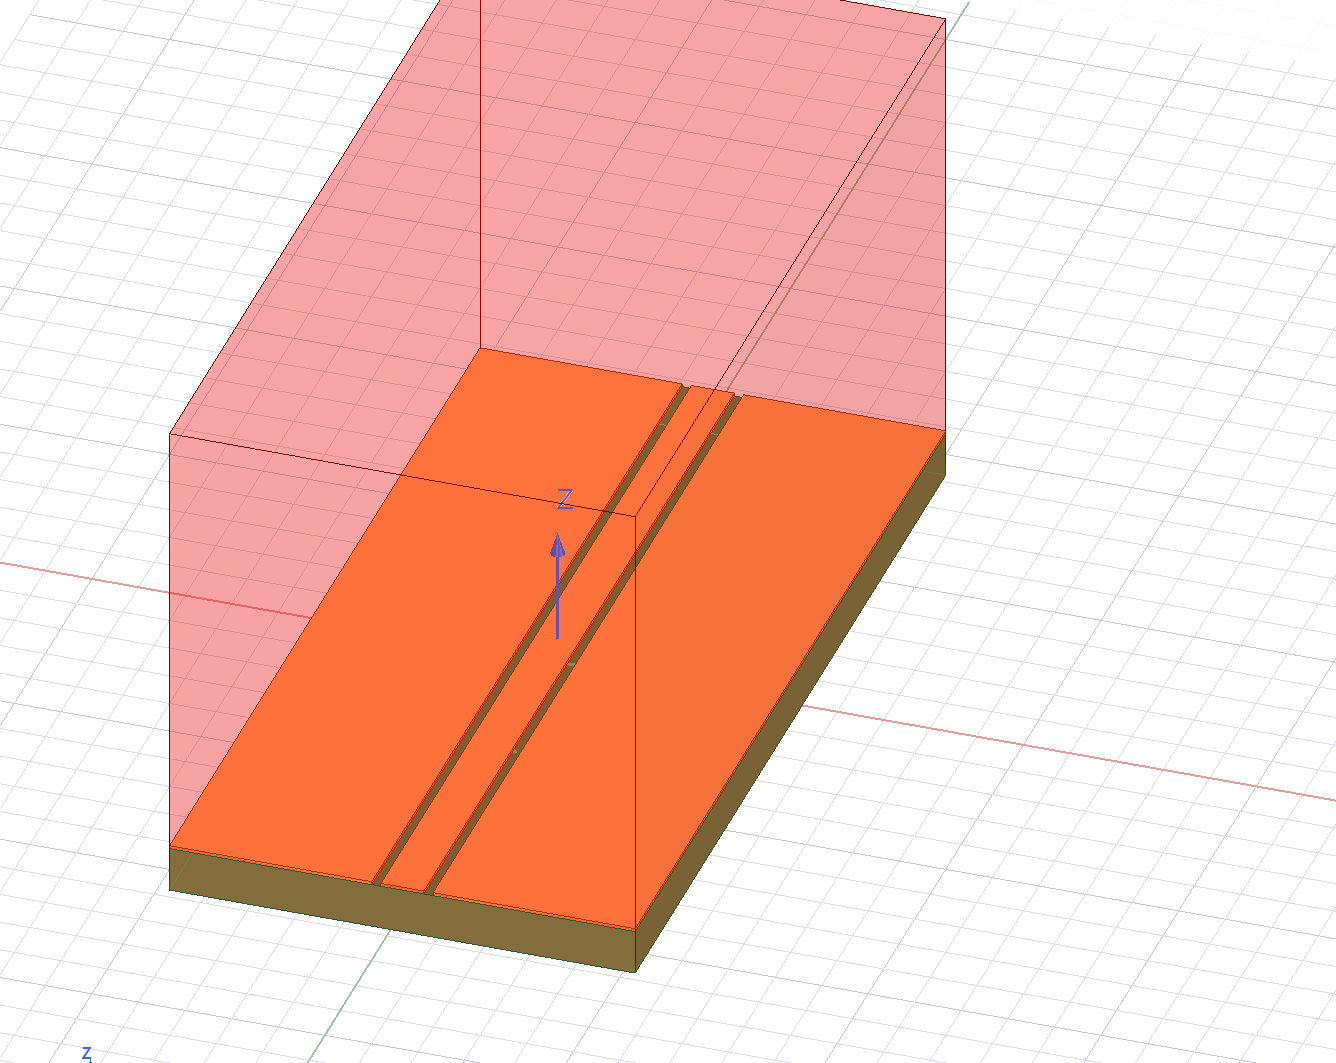
SubscriberHello everyone, I'm using wave ports to simulate the S-parameters of a CPW with ground. However, I've encountered an issue where the plot field function is disabled after simulation. Is there a method to visualize the electric field of my device?
Additionally, I'm curious about the S-parameters shown in dB. Are these values calculated based on power or voltage? Thank you for your assistance!
-
August 28, 2023 at 3:03 pm
Aymen Mzoughi
Ansys EmployeeMake sure you are plotting the field for the solution frequency, or use a discrete sweep and save the fields for the frequency points you would like to investigate.
For more information about S-Parameters in HFSS, please refer to the help documentation under ansyshelp.ansys.com
-
- The topic ‘HFSS field display problem’ is closed to new replies.


-
4673
-
1565
-
1386
-
1231
-
1021

© 2025 Copyright ANSYS, Inc. All rights reserved.


