-
-
November 28, 2023 at 12:11 pm
Hamid R
SubscriberHello everyone,
I’m currently working on analyzing the noise and vibration of an electric motor. As part of this analysis, I need to plot an ERP Level Waterfall Diagram. Unfortunately, I’m having trouble finding the tools or options to activate the legend, grid, and axis values. Could someone please provide guidance on how to activate these features?Â
-
December 4, 2023 at 10:18 am
-
December 4, 2023 at 3:27 pm
Hamid R
Subscriber-
December 5, 2023 at 11:35 am
Stefan Mutaf
Subscriber
-
-
December 6, 2023 at 2:33 pm
Hamid R
SubscriberHello Stefan, thank you for your help. I’m just curious why the graphical feature of your diagram is different from my result?
-
December 6, 2023 at 3:28 pm
Stefan Mutaf
SubscriberHello, I'm not quite sure what you meant by graphical feature. If you mean the diagram itself looks different, it's just because we're simulating different systems and also our diagrams probably have different resolutions. By the way, my current result does not look like the diagram I uploaded anymore after I excluded the first 6 rigid body modes I previously had in the modal analysis.Â
-
- The topic ‘
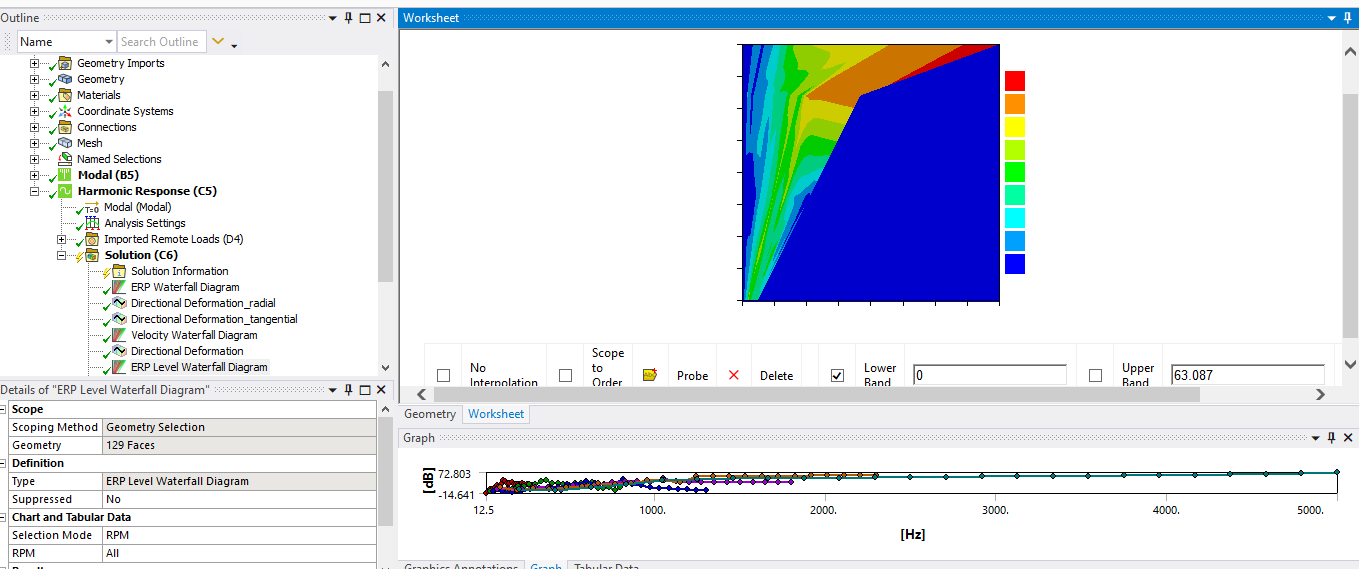
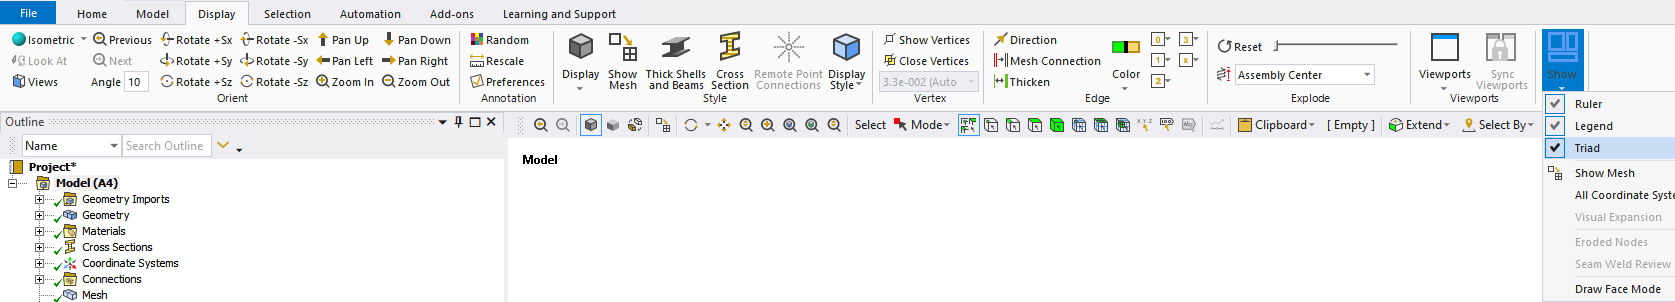
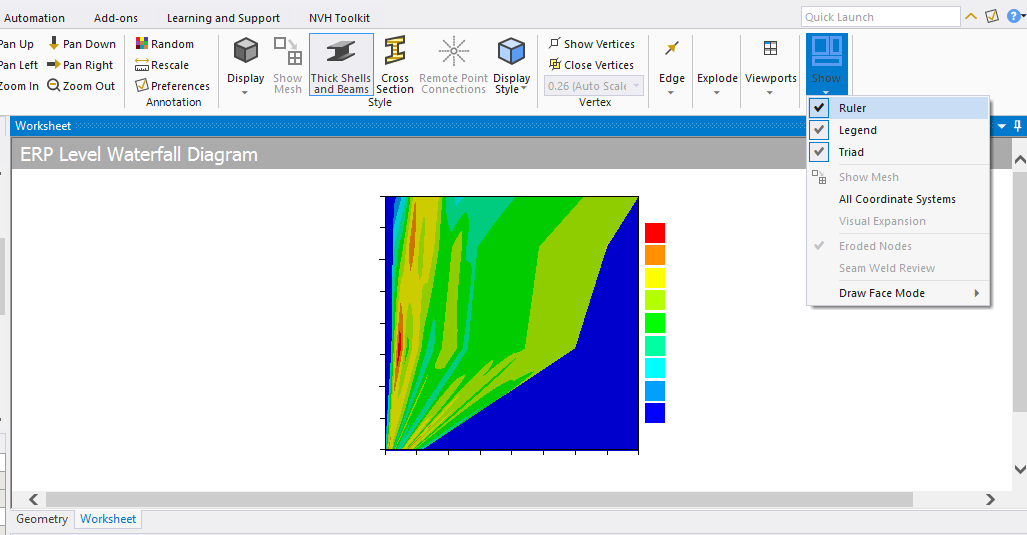
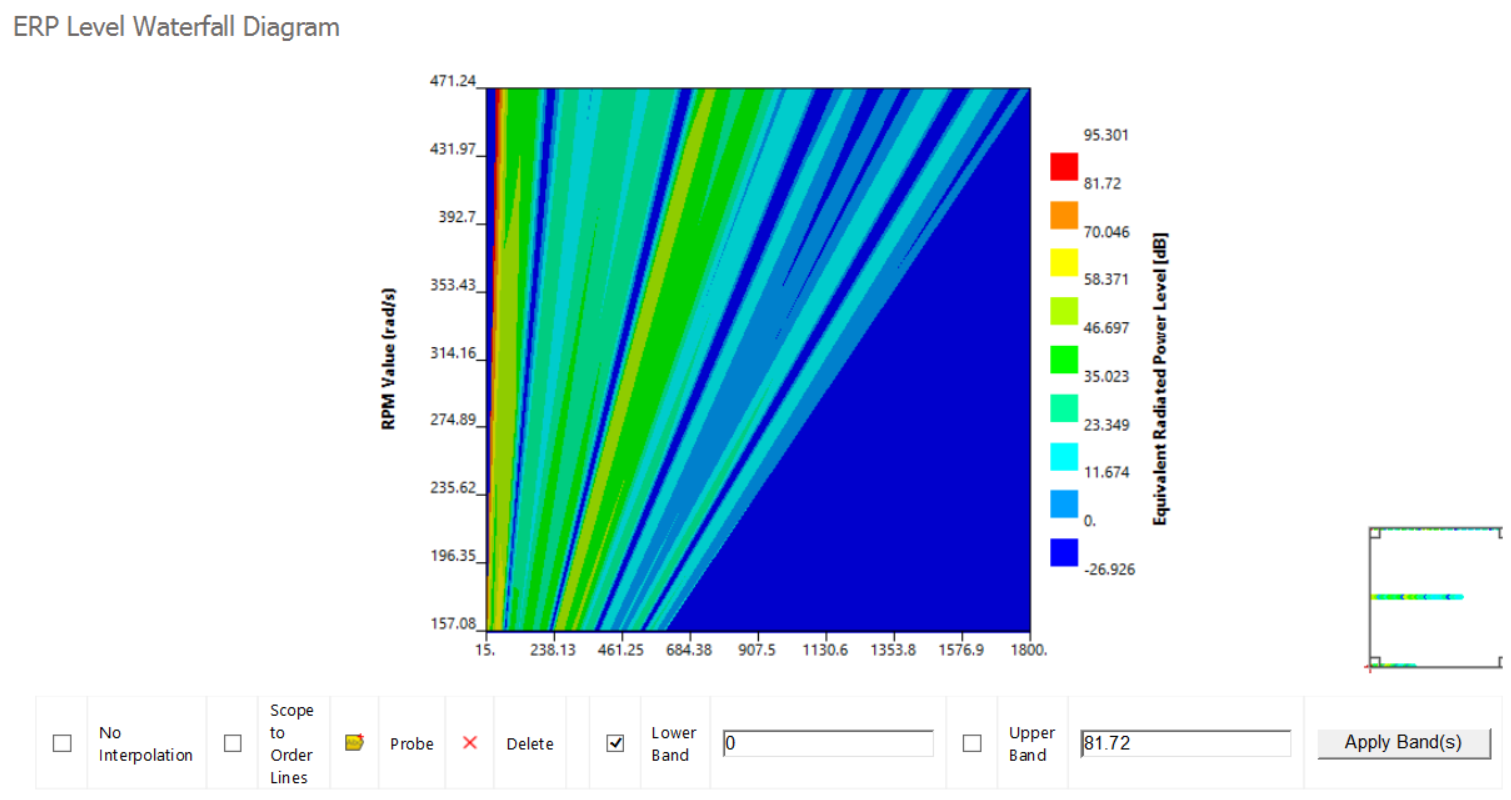
How to activate axes labels and values of Waterfall Diagram?’ is closed to new replies.
-
3241
-
1031
-
969
-
859
-
798
© 2025 Copyright ANSYS, Inc. All rights reserved.