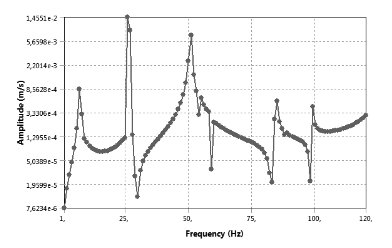
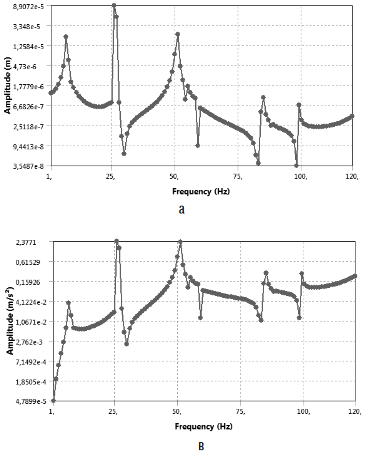
-
-
September 21, 2022 at 4:45 pm
-
September 22, 2022 at 10:17 am
Rob
Forum ModeratorCreate a monitor to collect the data and then use an xy plot. Note, you can also read data into Fluent and use the xy plot function: I did that for my PhD as Fluent's plotting was significantly better than Excel!
-
Viewing 1 reply thread
- The topic ‘Graphs in Fluent’ is closed to new replies.
Innovation Space


Trending discussions


- JACOBI Convergence Issue in ANSYS AQWA
- Is it able to solve turbomachinery using density-based solver in Fluent?
- Two-way FSI simulation
- Ensight Force_per_unit area_EV
- RIBBON WINDOW DISAPPEARED
- Fluent Meshing Error when .dsco not .stp
- Ansys Fluent for modelling Ocean Wave reactions to Wave Barriers
- Battery Pack cooling
- ISAT ABORT error
- UNASSIGNED INTERFACE ZONE DETECTED FOR INTERFACE…
Top Contributors


-
4597
-
1495
-
1386
-
1209
-
1021
Top Rated Tags


© 2025 Copyright ANSYS, Inc. All rights reserved.
Ansys does not support the usage of unauthorized Ansys software. Please visit www.ansys.com to obtain an official distribution.


