Ansys Assistant will be unavailable on the Learning Forum starting January 30. An upgraded version is coming soon. We apologize for any inconvenience and appreciate your patience. Stay tuned for updates.
General Mechanical

General Mechanical

Topics related to Mechanical Enterprise, Motion, Additive Print and more.

Graphs in Ansys workbench

    • shravani.bojja
      Subscriber

      Hello All,

      Could someone answer if we can plot a graph in workbench using APDL commands? For example, an array is created to store the force and displacements of a model using APDL command snippet, and by using *VPLOT command can we plot a graph against force and the displacement values? If so, where to check the generated graph in Workbench GUI?

      Regards,

      Shravani

    • ErKo
      Ansys Employee


      Hi

      A better alternative for WB/Mechnaical, one should use the chart object to create force vs displacement graph (see below):


      https://www.youtube.com/watch?v=CQF2WVVV_A8

      All the best

      Erik


      • shravani.bojja
        Subscriber


        Hello Erik

        My requirement is different here. I want to plot a graph based on APDL commands, once I have Eqivalent stresses at different design points. For this I trie to use *VPLOT,Mvalue_1(1,2),Mvalue_1(1,4), where Mvalue_1 is an array. 
        For the above command I can see below lines from the solve.out file, however I am not sure where to check if the graph is plotted in th workbench GUI. Kindly advice me further.

        GRAPHIC DISPLAY OF MATRIX= Mvalue_1(1,4)
         VECTOR FOR X AXIS= Mvalue_1(1,2)   
         NUMBER OF POINTS=    21  NUMBER OF CURVES=   1


    • ErKo
      Ansys Employee


      Hi

      See this post 

      https://simutechgroup.com/thermal-time-transient-loading-and-solution-in-ansys/

      and the command,

      /show

      In the apdl help manual or search for examples on the internet:


      https://www.padtinc.com/2013/08/29/20-apdl-commands-every-ansys-mechanical-user-should-know/

      All the best

      Erik


    • shravani.bojja
      Subscriber

      Hello Erik,

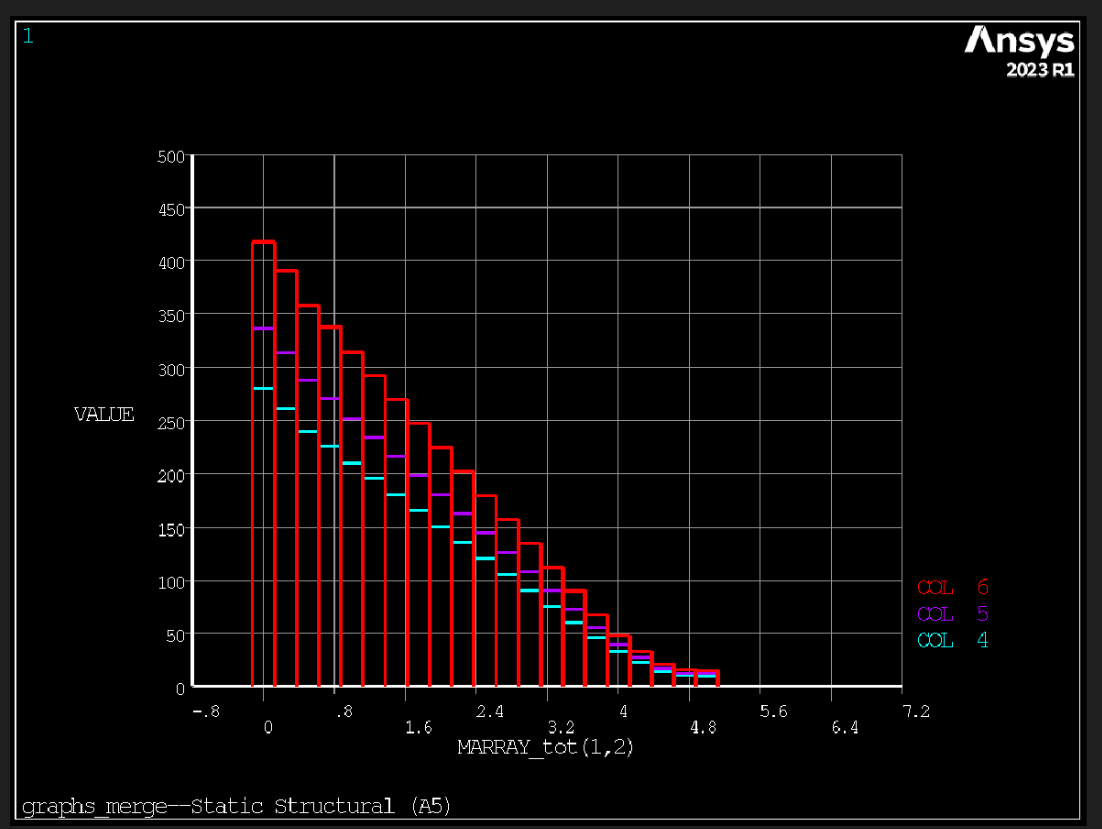
      I tried to use below commands for generating the graphs at different design points, however the graph is shown consisting of histograms (as shown below). Could you please let me know which commands can be added to make it a line graph (as required).

      Commands:

      *VPLOT,Mvalue_tot(1,2),Mvalue_tot(1,4),5,6
      /SHOW,png
      /replot

      Resulted graph:

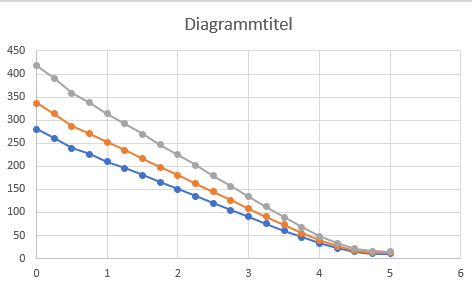
      Required graph (taken from excel file):

      Best Regards,

      Shravani

Viewing 3 reply threads
  • The topic ‘Graphs in Ansys workbench’ is closed to new replies.
[bingo_chatbox]