
TAGGED: graph, post-processor, static-structural
-
-
October 7, 2021 at 2:20 pm
Jamal
SubscriberHi there,
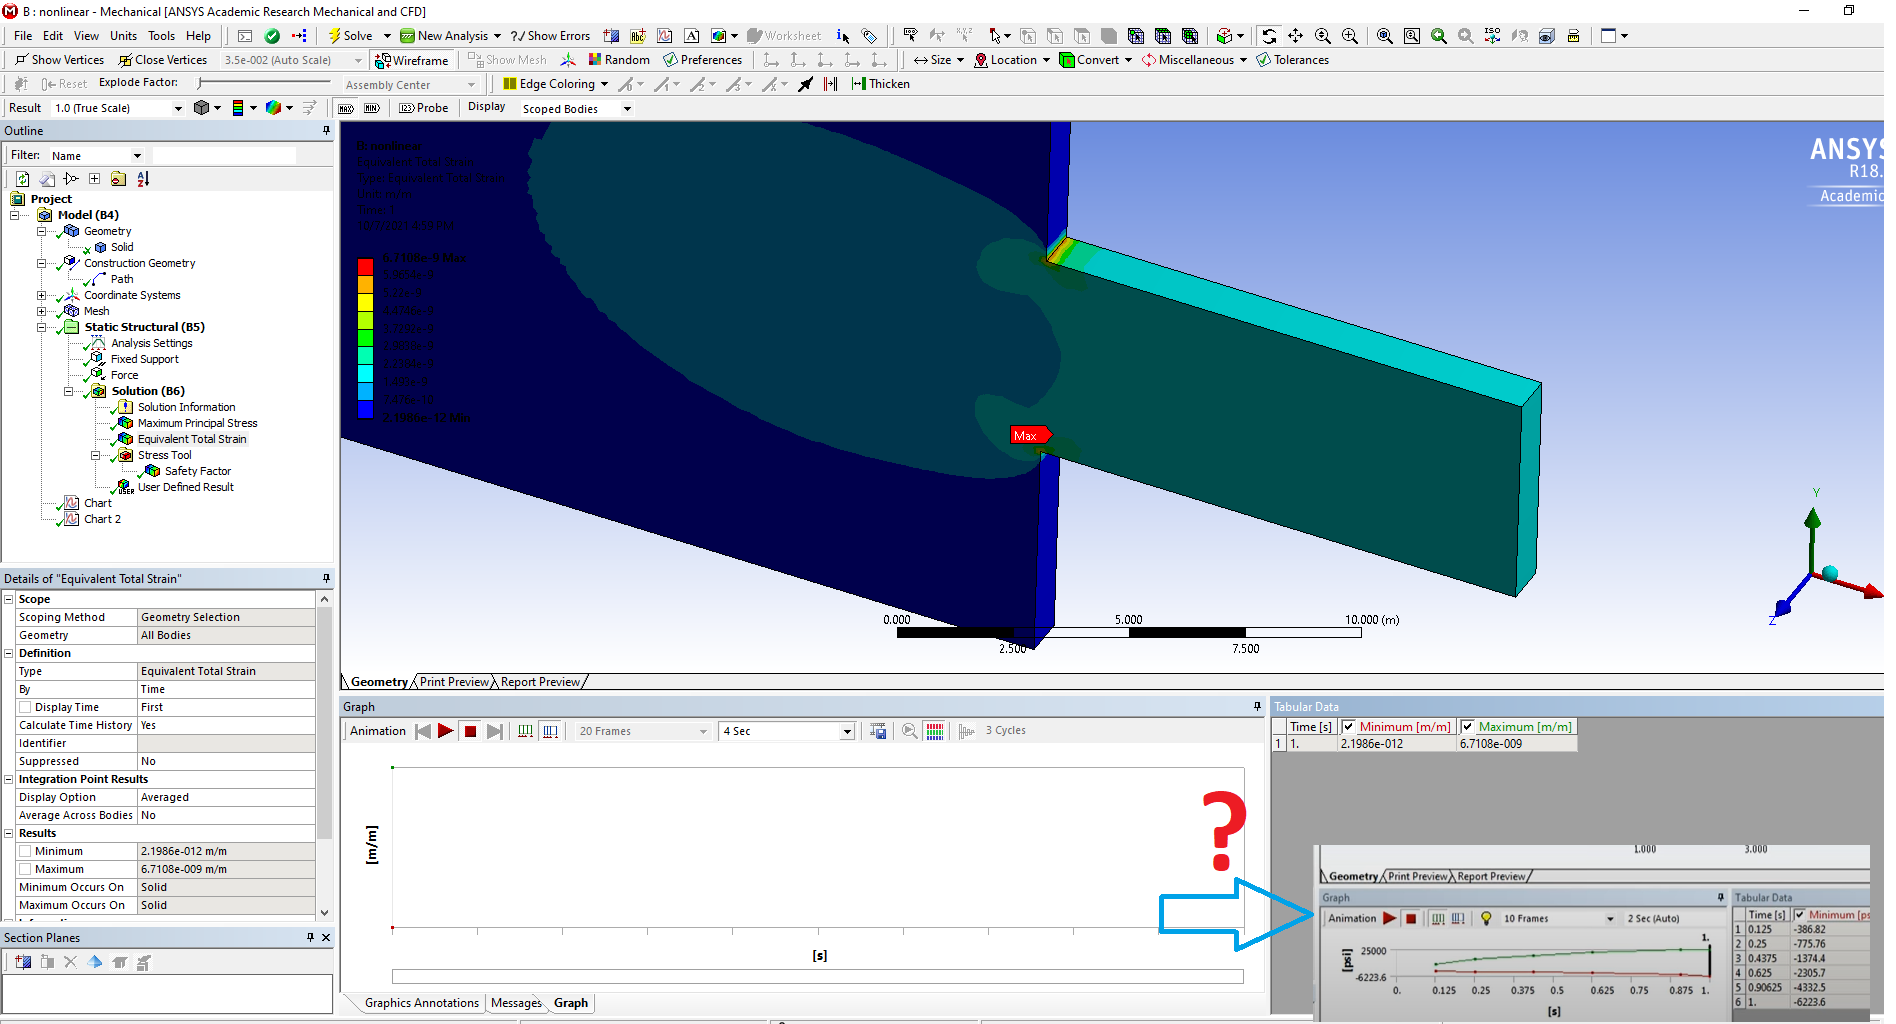
How can I get the change of strain in terms of time in my graph similar the one shown by the arrow in the lower right hand side of the photo. I only get max and min values in the graph.
The force is applied in 1 step in both my model and the one shows a curve.
October 7, 2021 at 2:45 pmErKo
Ansys EmployeeHi
You probably need to have some sub steps I suppose so you have more than one result step to show - so try changing substeps to 10 in the analysis settings and step control.
See this discussion about sub steps:
You donÔÇÖt wanna step to this: Breaking down Loadsteps and Substeps in ANSYS Mechanical ÔÇô PADT, Inc. ÔÇô The Blog (padtinc.com)
All the best
Erik
Viewing 1 reply thread- The topic ‘Getting a full graph and tabular data from result in workbench mechanical’ is closed to new replies.
Innovation Space Trending discussions
 Top Contributors
-
peteroznewman
 5139
5139 -
scabo
 1831
1831 -
Dennis Chen
 1387
1387 -
javat33489
 1248
1248 -
Shyam Prasad V Atri
1021
Top Rated Tags
© 2026 Copyright ANSYS, Inc. All rights reserved.
Ansys does not support the usage of unauthorized Ansys software. Please visit www.ansys.com to obtain an official distribution.
-


The Ansys Learning Forum is a public forum. You are prohibited from providing (i) information that is confidential to You, your employer, or any third party, (ii) Personal Data or individually identifiable health information, (iii) any information that is U.S. Government Classified, Controlled Unclassified Information, International Traffic in Arms Regulators (ITAR) or Export Administration Regulators (EAR) controlled or otherwise have been determined by the United States Government or by a foreign government to require protection against unauthorized disclosure for reasons of national security, or (iv) topics or information restricted by the People's Republic of China data protection and privacy laws.
