-
-
September 12, 2023 at 1:56 pm
Albi.Pani
SubscriberHi, I am simulating a simple fdtd simulation with a plane wave with no incidence angle and amplitude of 10^8 in free space.
Then I visualize the results on a "frequency-domain field and power monitor" that is parallel to the axis of propagation.
What should I expect to see?
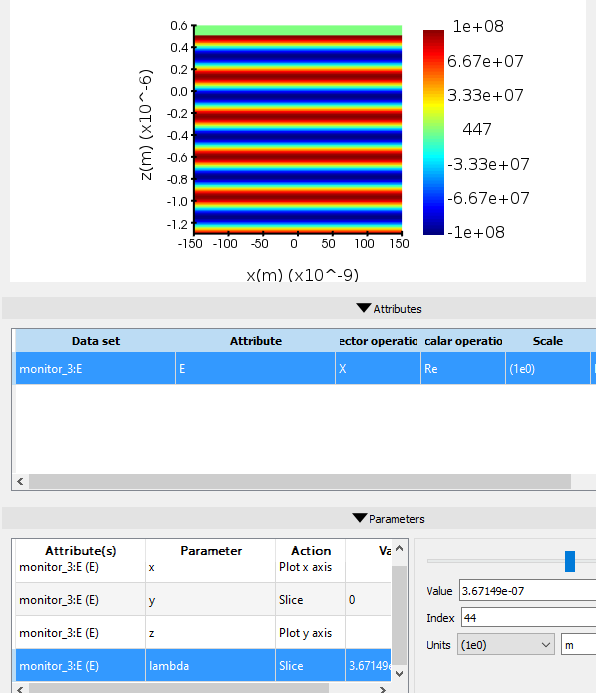
I expect a plane wave when I look only at the wavelength of 367 nm but I have different results on the monitor:
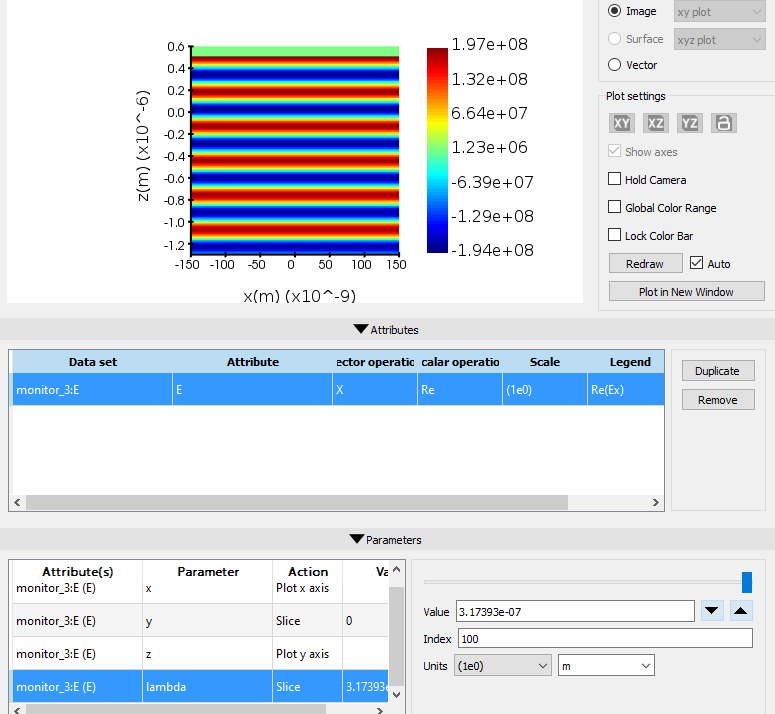
Why does a plane wave appear with wavelength of 317 nm, that has also an higher amplitude than the injected one?
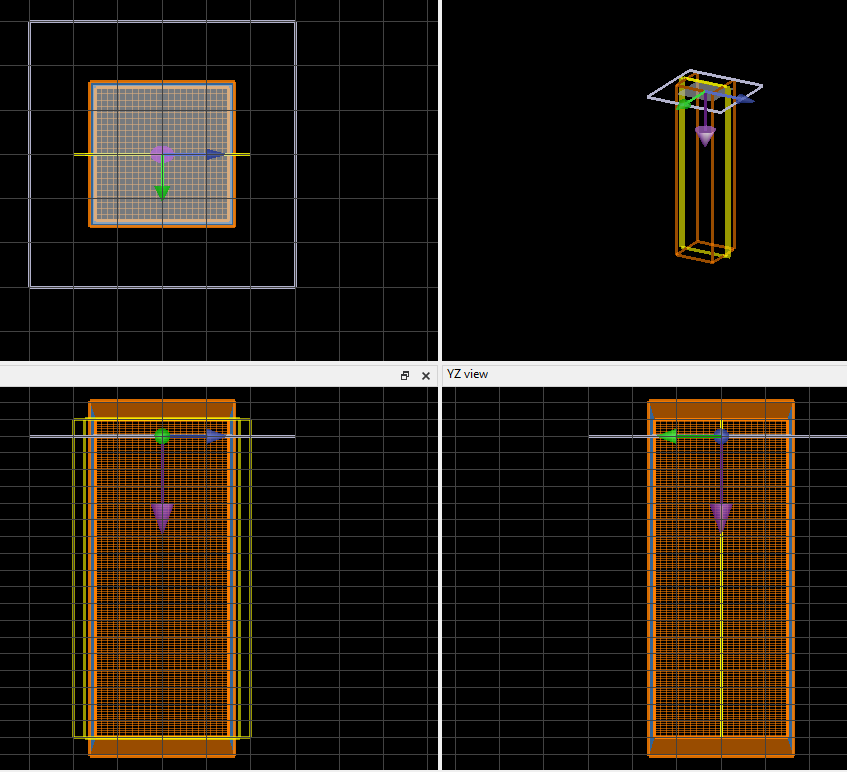
Setup:
Thank you
-
September 12, 2023 at 5:01 pm
Guilin Sun
Ansys EmployeeWhat you expect is the amplitude but what you visualize is the real part.
so you can visualize the amplitude, eg, choose Abs instead of Re.
-
September 12, 2023 at 6:09 pm
Albi.Pani
SubscriberHi Guilin,
thank you for your answer but the problem is the same. I see an high amplitude also in the wavelength where no plane wave should exist, as you can see in the third picture. Why?
-
September 12, 2023 at 7:12 pm
Guilin Sun
Ansys EmployeeI am not sure what do you mean "the problem is the same". I do not believe the Abs (absolute value) and the Re (real part) give the same result.
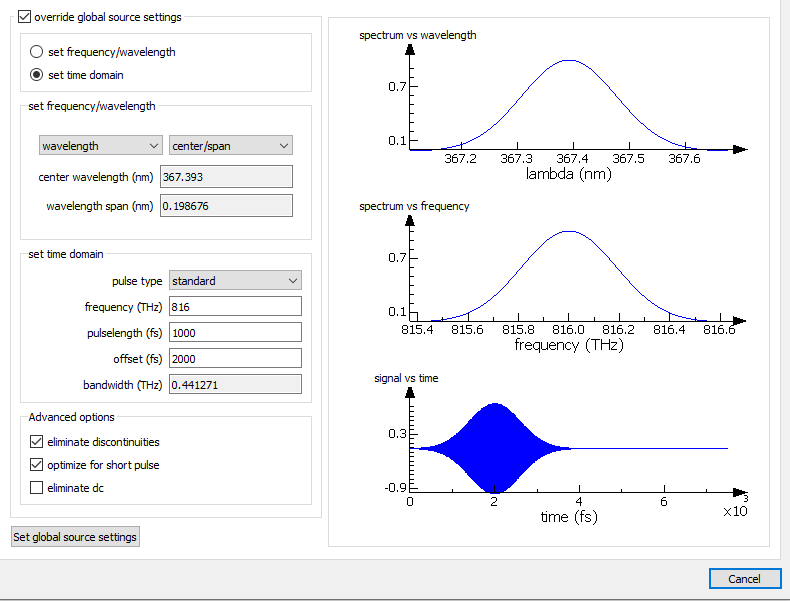
As for " high amplitude also in the wavelength where no plane wave should exist", it is normal. Please check the source spectrum: when there is a pulse, it has much broader spectrum than what you specified in bandwidth. The latter is to ensure the intensity within the specified bandwidth is large enough to lead to accurate normalized result: Understanding frequency domain CW normalization
Your result once again shows that we should only record and get the result within the source bandwidth, not outside of it. When the source intensity is small, dividing a small number can lead to large error.
-
September 13, 2023 at 1:02 am
Albi.Pani
SubscriberThank you. Unfortunately in my final simulation I am trying to simulate a non linear process so I can not use a pulse. But I will think about it.
-
September 13, 2023 at 3:33 pm
Guilin Sun
Ansys EmployeeIf you do not use pulse, then you may need to carefully rethink the frequency-domain result from Fourier transform as it requires the signal decays completely. Probably you can use the real part from the time monitor which only records the fields at the end of the simulation. Please take sometime.
-
- The topic ‘Frequency and power monitor parallel to the axis of propagation of a wave?’ is closed to new replies.


-
3407
-
1057
-
1051
-
896
-
882

© 2025 Copyright ANSYS, Inc. All rights reserved.


