-
-
February 22, 2024 at 8:47 am
Z.Shahrabifarahani
SubscriberHi all,
I am doing my converge test for my simulation about the right position of my monitor to measure the transmission rate thorugh my optical nanofiber (ONF) waveguide. The ONF has the diameter of 700 nm. I put my "mode expansion monitor" in different position starting from 48 um to 68 um away from the source and each mode expansion monitor is ttached to a DFT monitor at each position. When I plot the T_forward and T_net of the fundamental mode vs position of monitor, I observe a fluctuation in transmission with range 2% (Please refer to the plot).Â
I believe 2% fluctuation is pretty significant.
I increased my FDTD region to 6 um * 6 um, as I was thinkig the interference from the boundries is causing this problem. But it didn't make any difference in fluctuation.Â
I wonder why it happens and how I can fix this problem. Further details about the parameters is written in the plot.
Sincerely,
Zohreh -
February 22, 2024 at 10:19 am
Z.Shahrabifarahani
SubscriberÂ
Â
Â
I also put a 2D monitor along my ONF to see the intensity behaviour along my waveguide. The intensity in the center of the waveguide along the ONF is as follow. I did not expect to see this fluctuation in intensity And I wonder why!
The FDTD region is 6*6 um for this simulation. The mesh setting is also auto non-uniform with accuracy level 4 and PML layer =26.Â
Â
Â
Â
-
February 22, 2024 at 7:20 pm
Guilin Sun
Ansys EmployeeThis can be due to several factors:
1: there is reflection from either the device itsself , or PML;
2: the simulation time is not long enough. To know if it is long enough, please add a time monitor at the far end (z>70um) and check the signal to see if it is complete.
3: there is any structure along the waveguide.
Please upload some screenshots about the simulation and settings if you could not find the cause.
-
February 24, 2024 at 8:40 am
Z.Shahrabifarahani
SubscriberÂ
Dear Guilin,Â
Thank you for your reply.I added the time monitor at the end of my simulation (85 um away from the source) and I got the following result:Â
So, I believe there is no problem about the time of simulation (Please correct me if I am wrong).
About PML, I think it is high enough but I could try a value more than 26.
Would you recommend me to check the result for values of mesh accuracy with level higher than 4?Â
Â
-
February 25, 2024 at 3:28 am
Z.Shahrabifarahani
SubscriberÂ
Following your suggestion about higher numbers for PML, I tried PML= 26, 28, 30, 32, 34, but for an optical nanofiber with diameter 700 nm which has an structure. I already put time-monitor for this simulation too and it seems the time of measurement is sufficient.Â
To understand my structure please refer to the first figure and my results for different PML, please see the second plot (there are still fulctuation in transmission)Â
-
February 26, 2024 at 3:39 am
-
February 26, 2024 at 5:47 pm
Guilin Sun
Ansys EmployeeIt seems the simulation time seems ok. BUt please use log scale and see if the signal is small enough at the end of simulaiton.
I believe the field changing behavior is physical as the deviceÂ
as this device is not uniform so there is round-reflections because of the taper structures.
As for fluctuation from the monitor location, it might be due to interpolation error: the monitor needs the result interpolated since the Yee cell does not allocate the field components in the same location:
You may need to use an override mesh for the monitor along the propagation direction only, and place the monitor exactly the same location relative to the mesh, for exmaple all monitors are in the mesh grid plane.
A simple suggestion for PML: to check the effect, 2 or 4 layer change might be small. I would suggest to use 8 layers.
-
February 26, 2024 at 11:45 pm
Z.Shahrabifarahani
SubscriberThank you for your reply.
I also believe the interpolation in monitor position makes this fluctuation. I will add extra mesh at monitor positions to hopefully get a more accurate result.Â
-
February 27, 2024 at 7:23 pm
Guilin Sun
Ansys EmployeeIf you use "power" monitor it automatically changes its location by minimizing the interpolation. Only the profile monitor stays where you placed and needs more interpolations.
If the monitor is located in a uniform mesh region, the flutuation should be small.
Â
-
March 1, 2024 at 3:51 am
Z.Shahrabifarahani
SubscriberHi again.Â
I ran my simulation one more time with parameters as follows:- Â ONF diameter: 700 nm (No structure)
- FDTD size: 3 um by 3 um by 110 um
- FDTD mesh setting: auto non-uniform, mesh accuracy: 4
- PML layer: 26
- Monitors to calculate the transmission rate: DFTMonitor + Mode expansion monitor (Each mode expansion monitor is attached to a DFT monitor at the same positiond
- Monitor positions: 49 to 67 um away from the source with step 1 um.
- Mesh grid size at monitor positions: 4 nm at each x, y, z directions.
Here is the result of the transmision rate at each monitor position. The transmission is actually the t-forward value for each mode expanssion monitor for my desired mode.
 As you can see, adding the mesh grid in monitor positions did not really solve the problem. I don't know what is wrong in my setting for getting such a fluctuation.ÂÂ
Â
-
March 1, 2024 at 3:56 am
Z.Shahrabifarahani
SubscriberIs there any way that I send my simulation file to you, to check if there is a problem in my file?
Â
-
March 1, 2024 at 5:02 pm
Guilin Sun
Ansys EmployeeUnfortunately the forum does not allow to upload files and we are not allowed to open customer files.
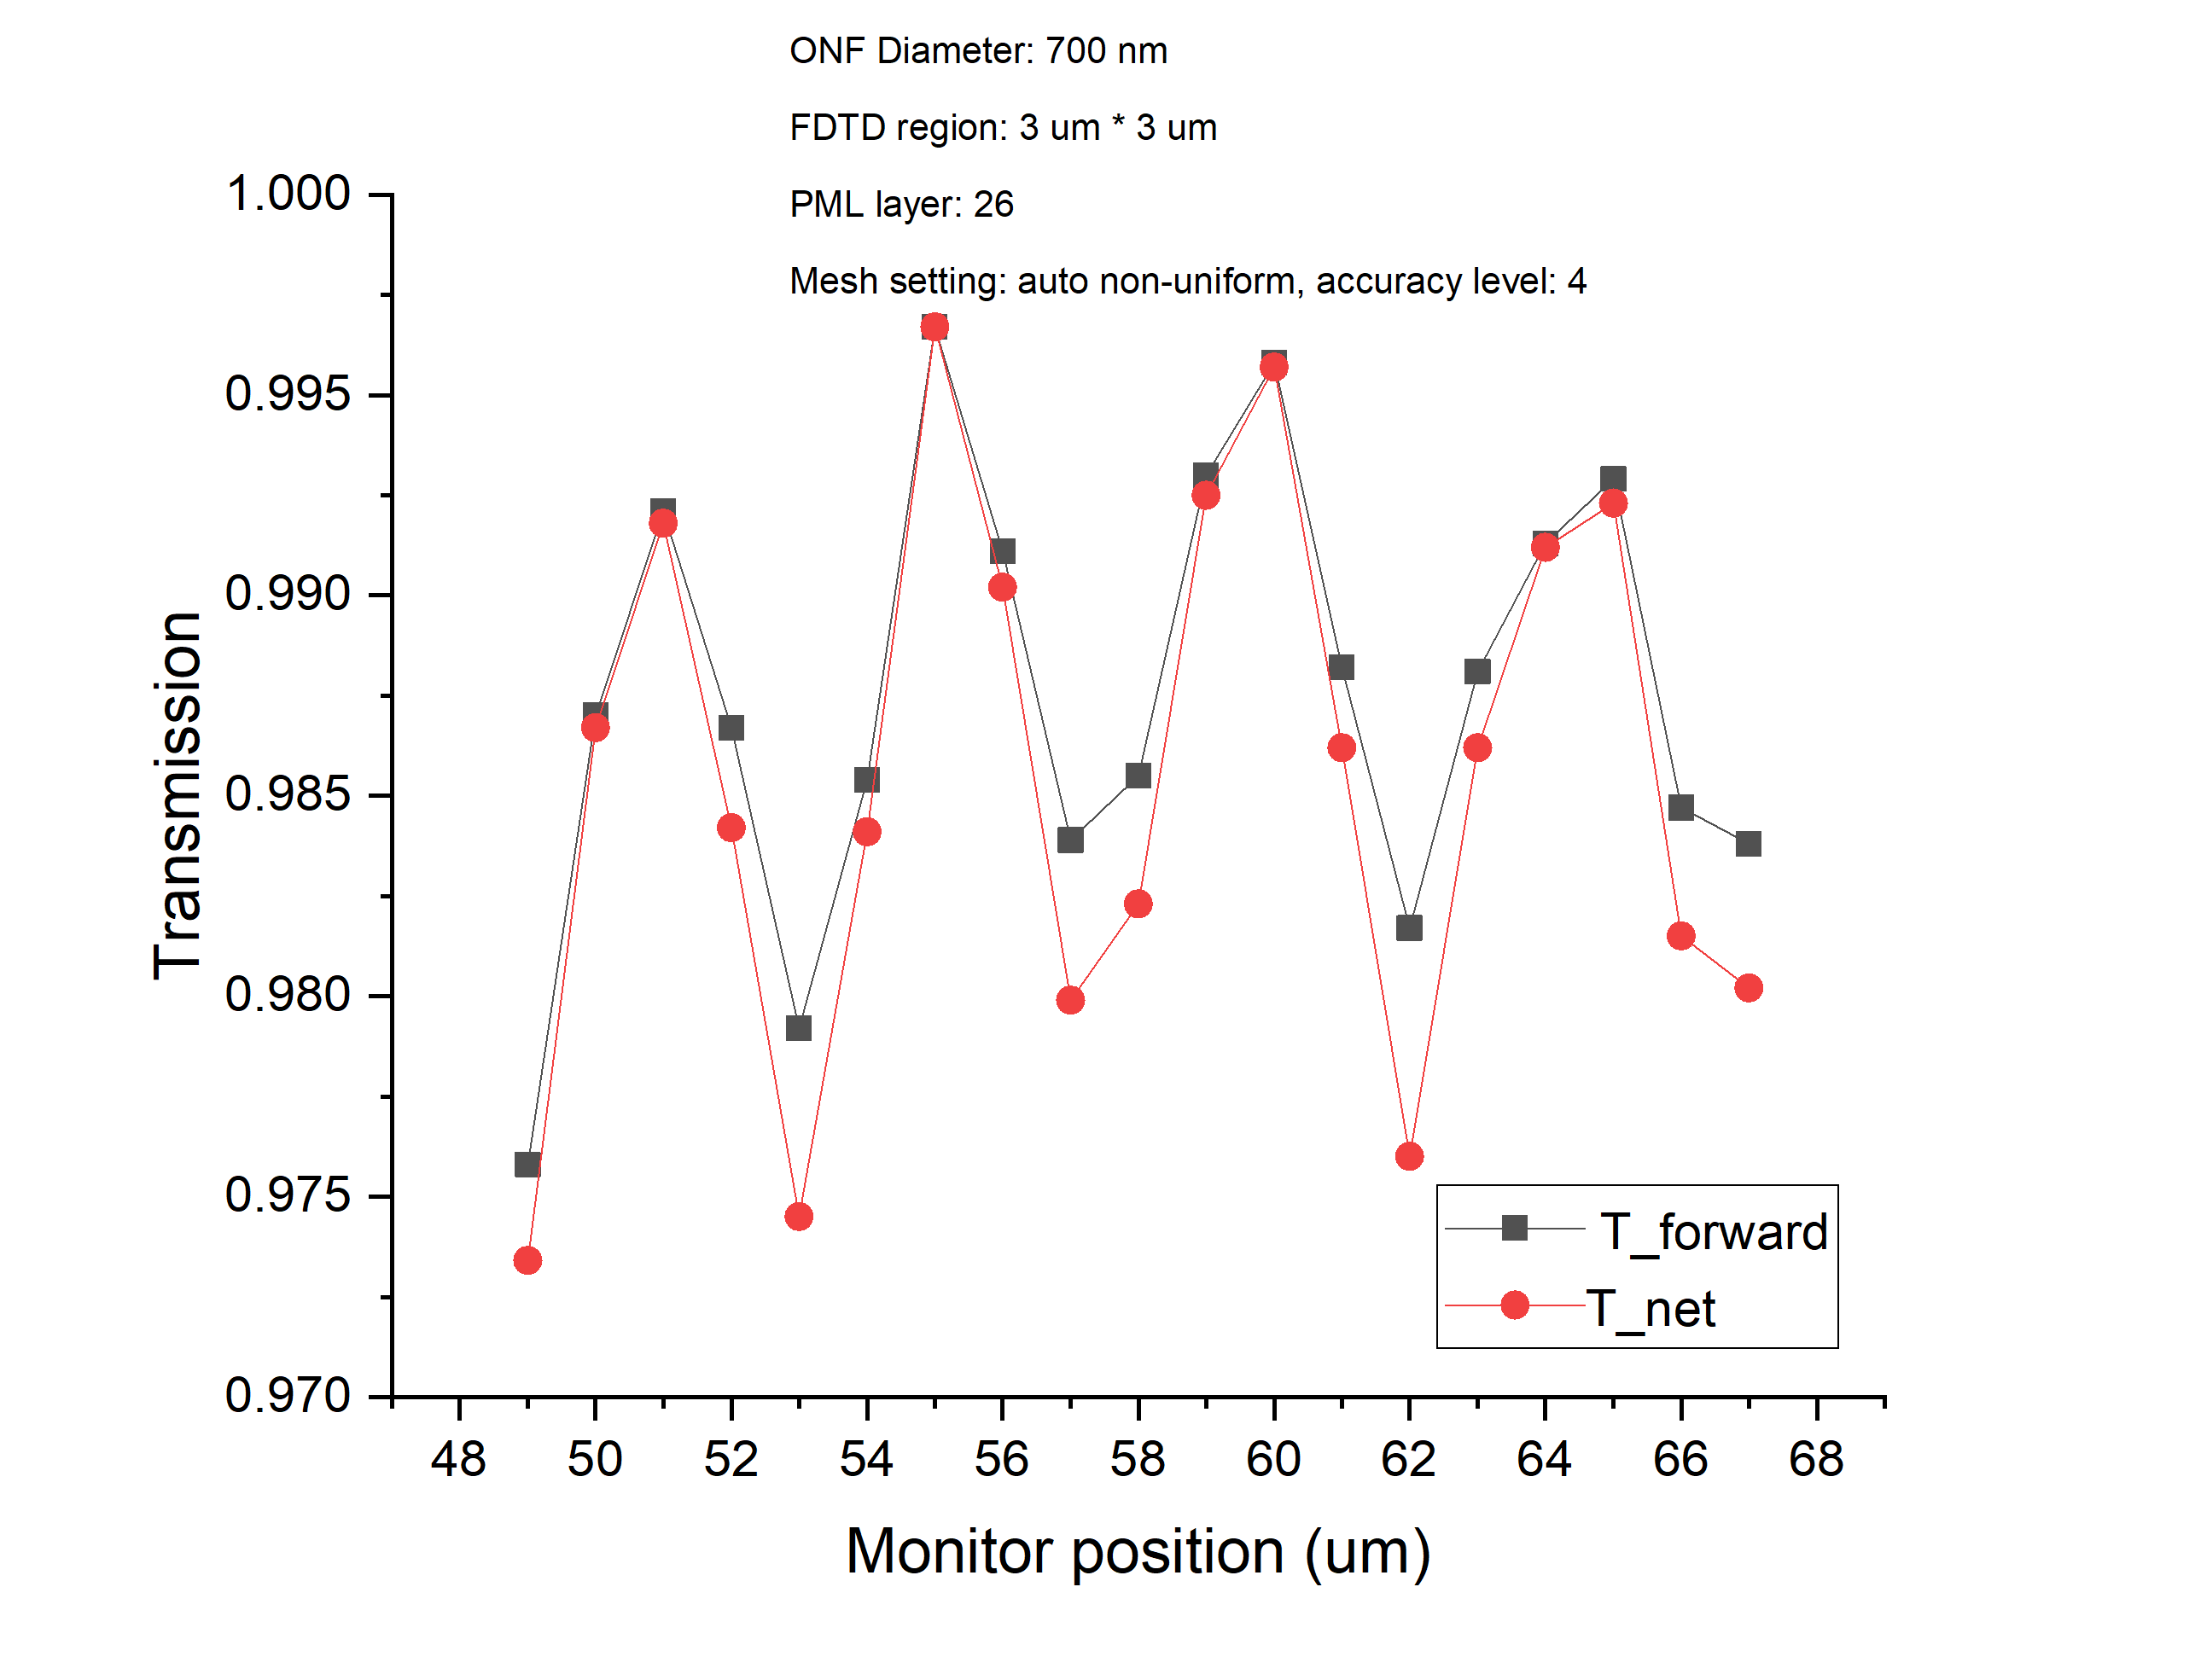
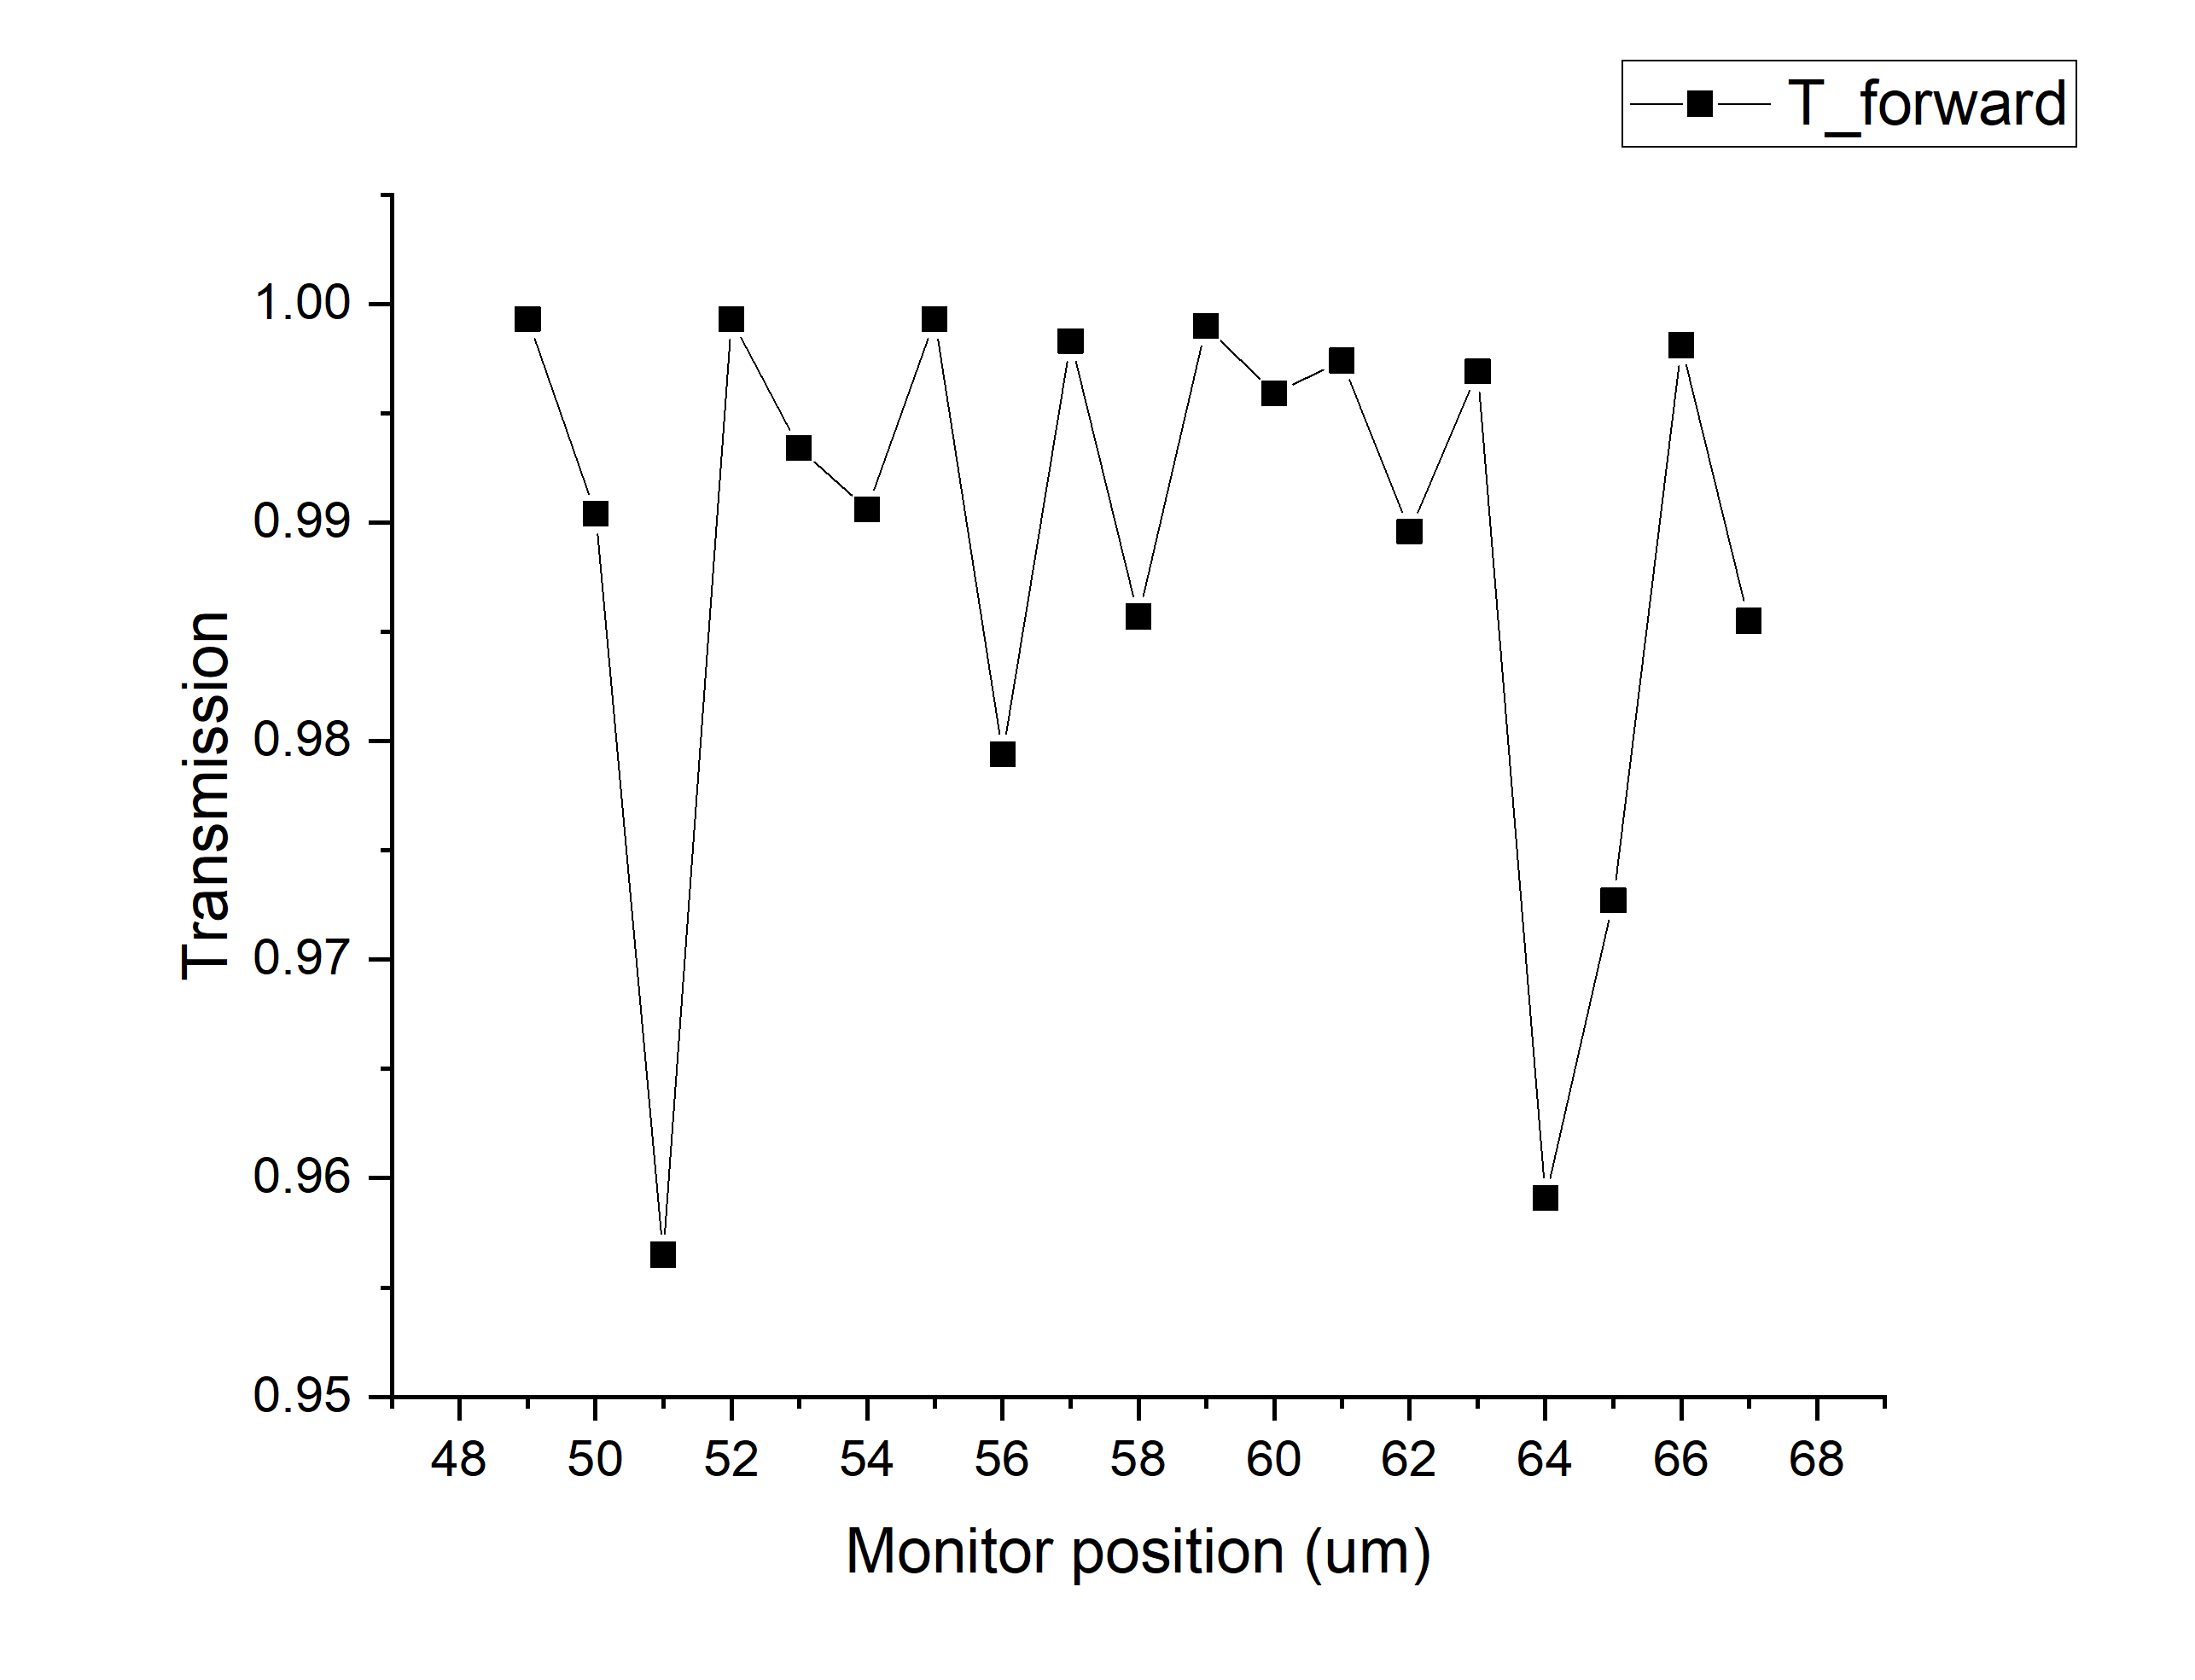
I would suggest that you check the fields (E and H) for different monitors and see if they are the same. Depending on the structure, due to numerical errors, small flutuation is understandable. in your case, due to higher orders, the total fields recorded by different monitors might be slightly different. Those modes will interfere with each other. thus the decomposition at different might be slightly different.
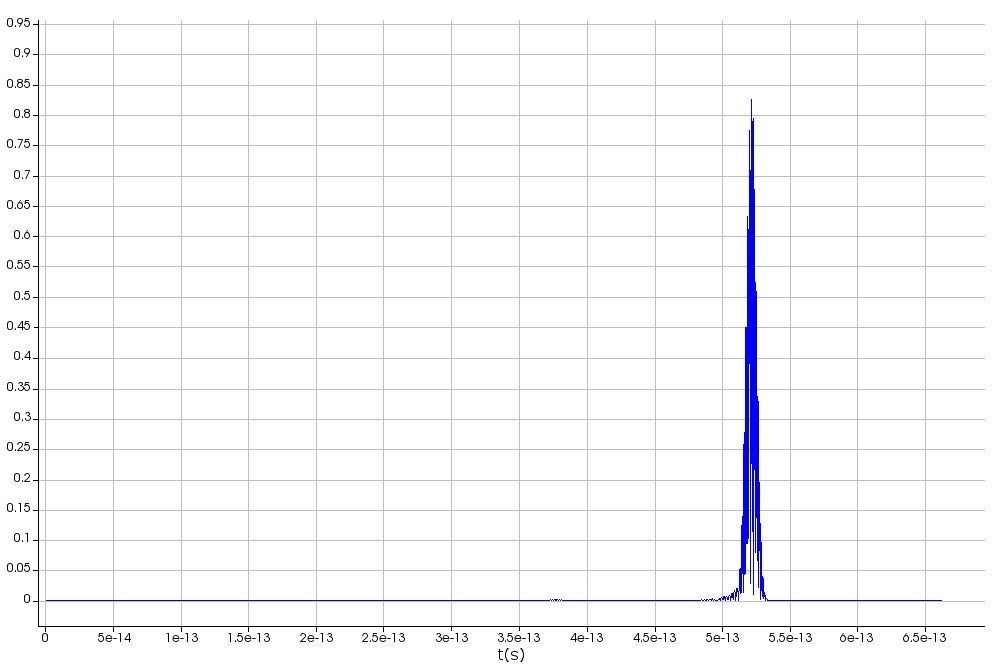
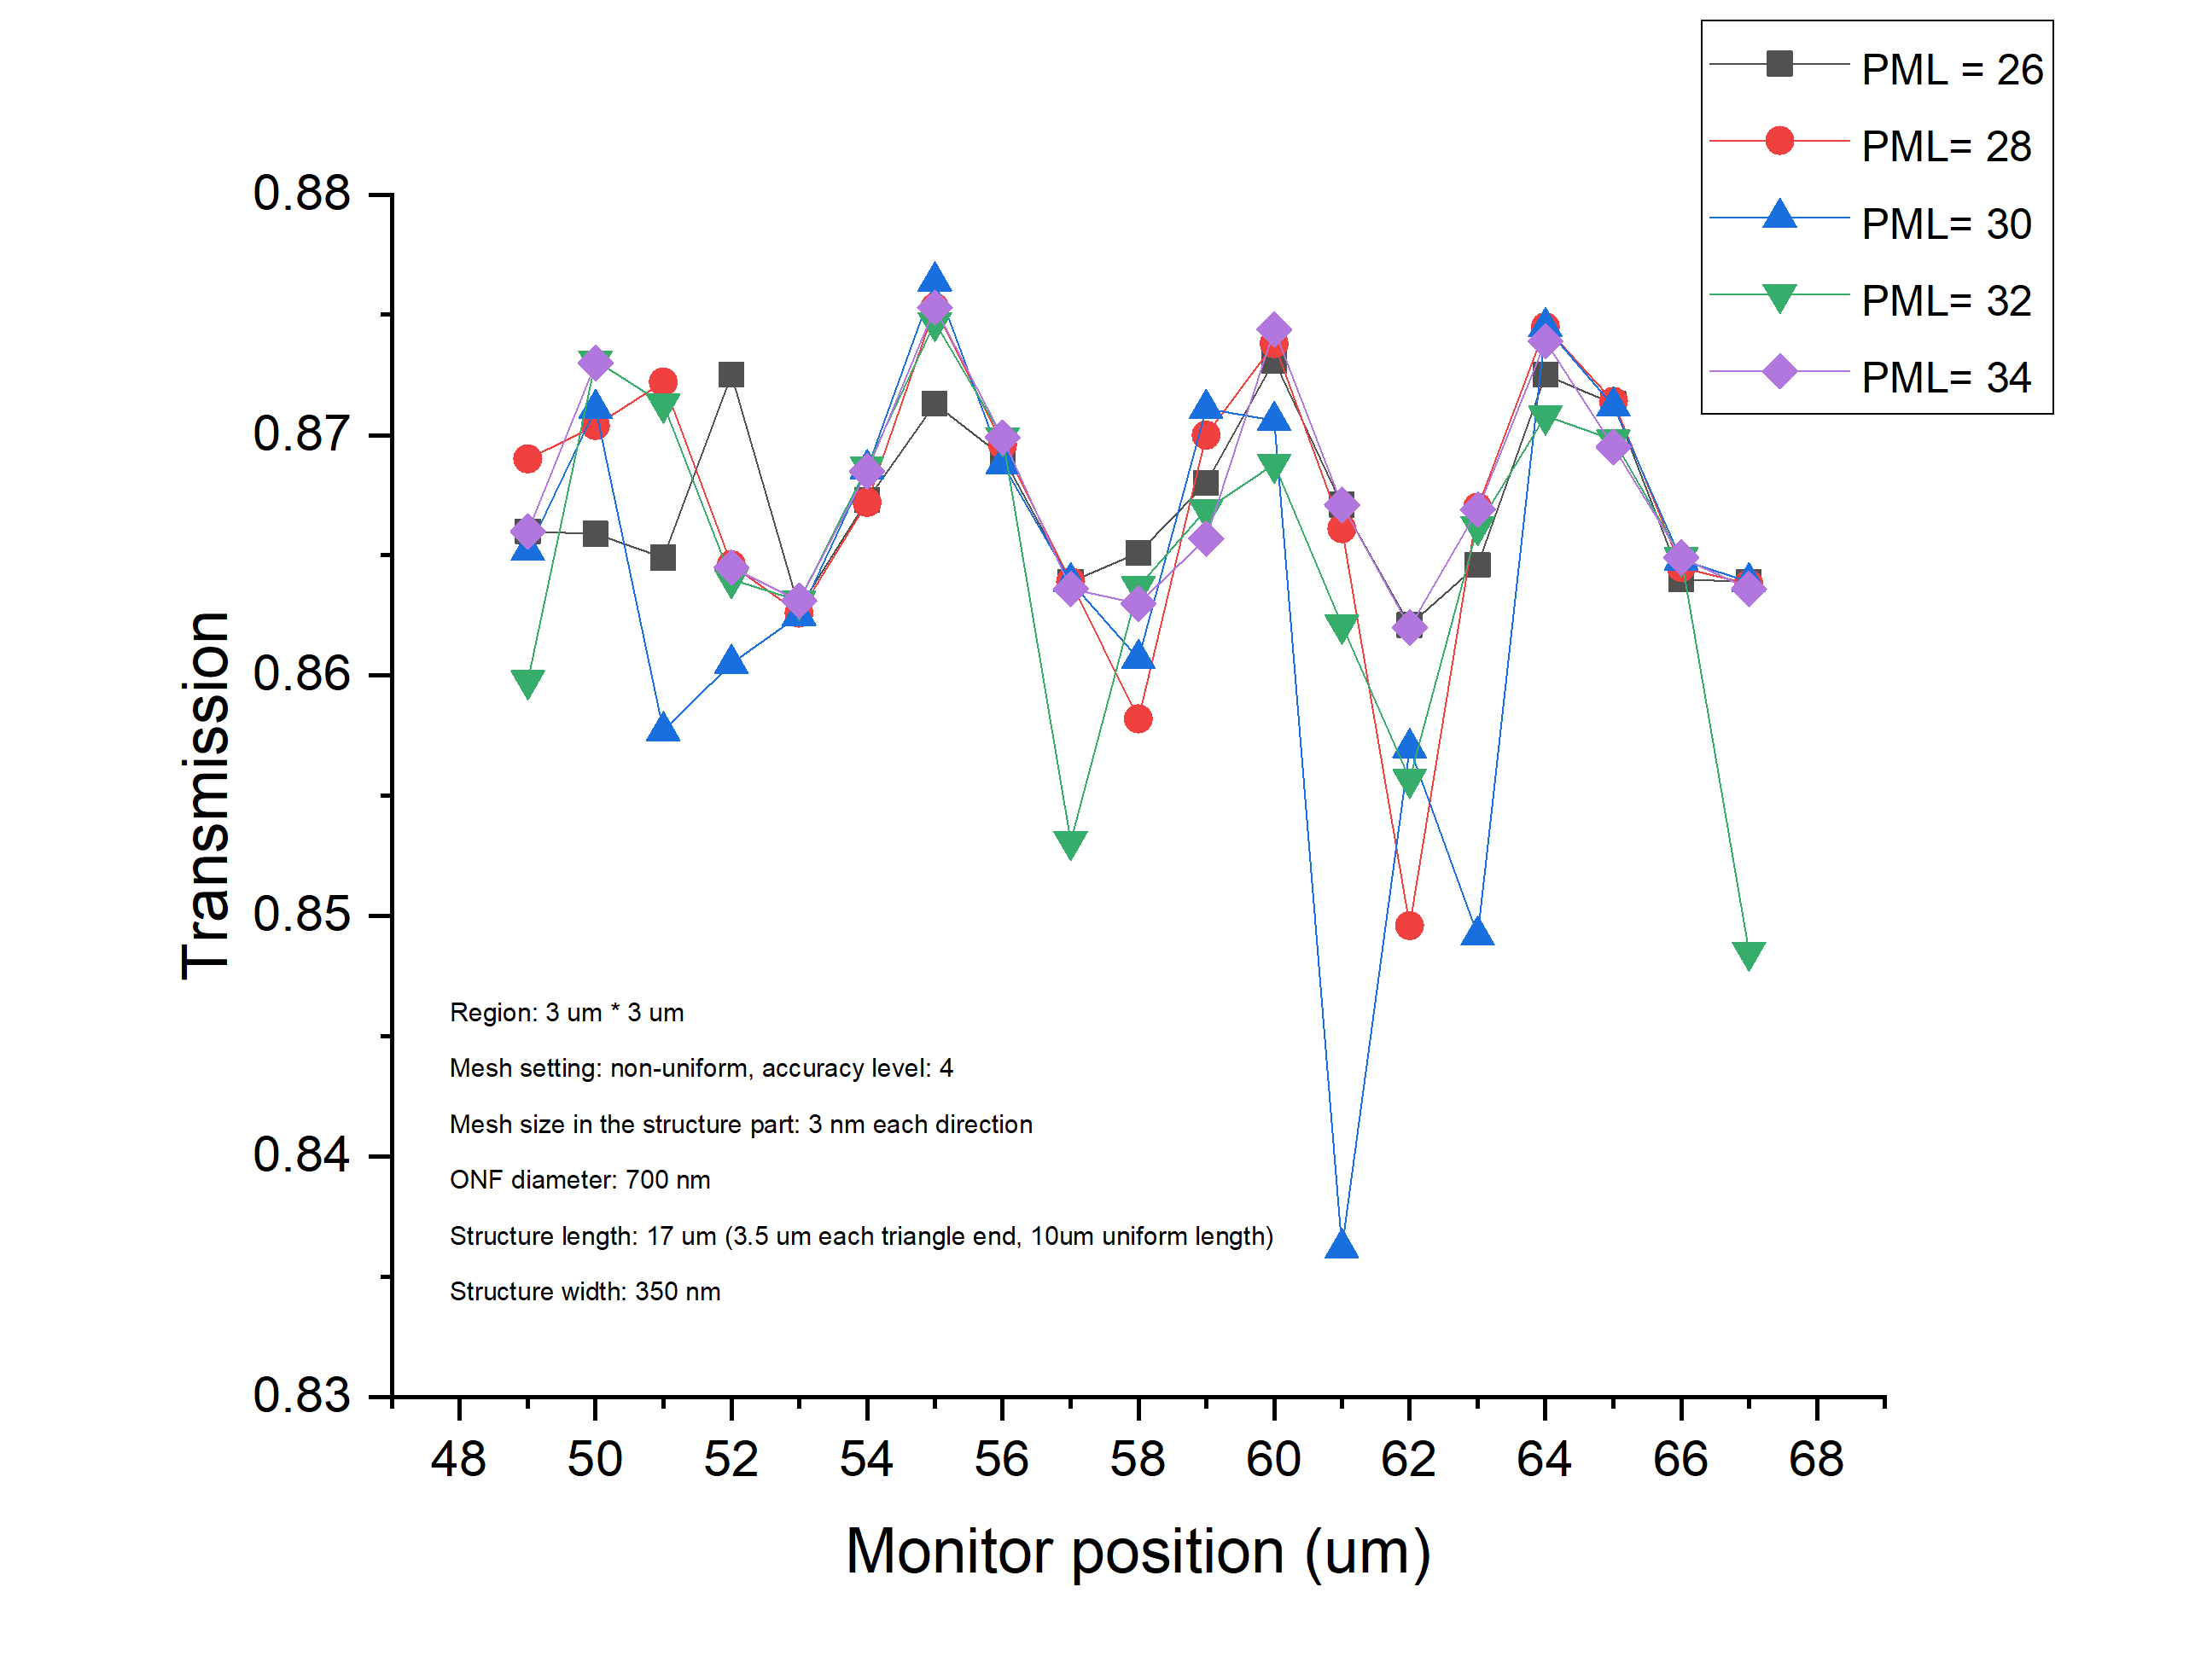
As long as you used sufficient thick PML, small enough autoshutoff min and long enough simulation time, the result is reliable.Â
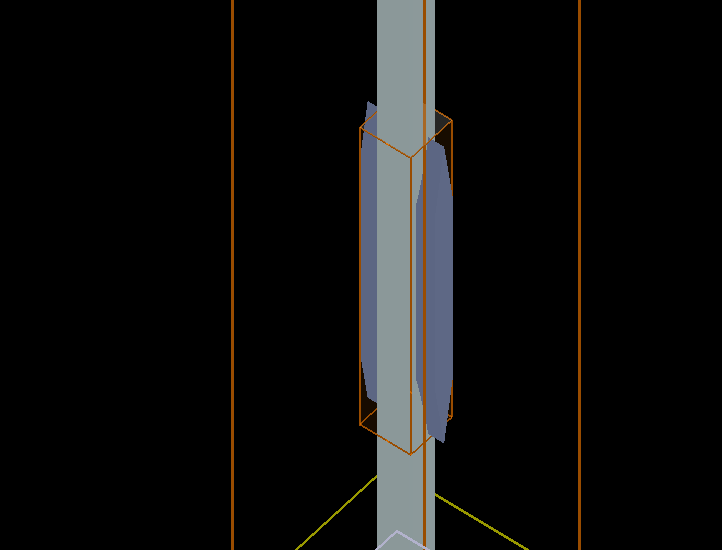
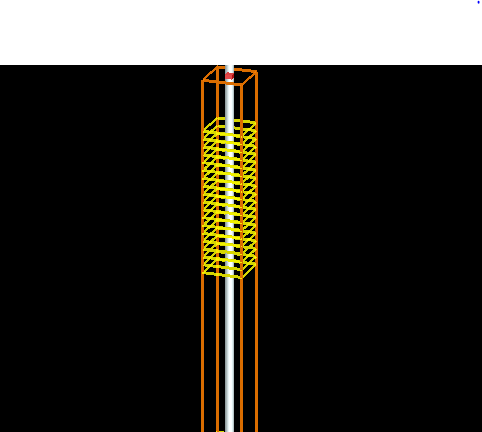
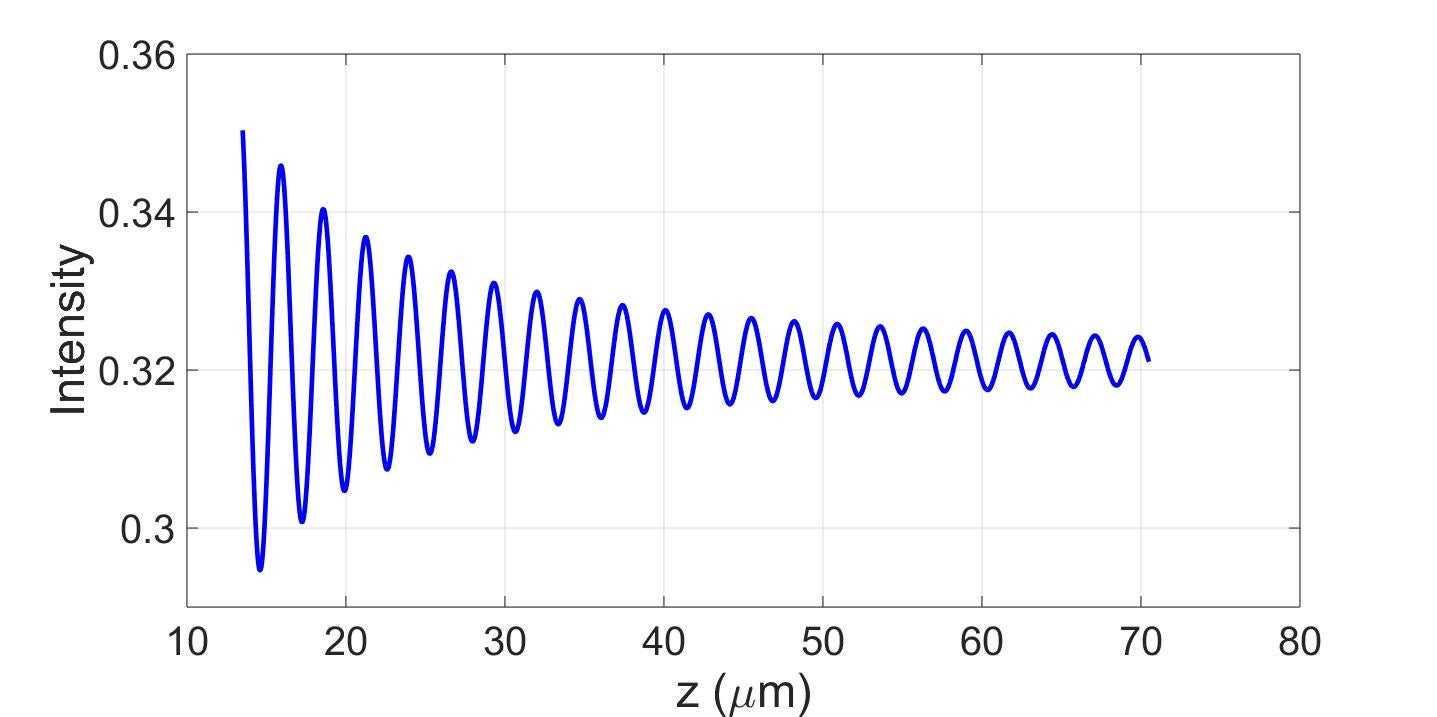
I suggest that you simulate a simple straight waveguide (eg, remove the typers) and check the result. In particular check the intensity along the waveguide and see if it is uniform. there will be small changes due to PML reflections, not sufficiently small autoshutoff min (not long enough simulaiton time). The flutuation will be smaller and smaller with smaller mesh size, thick enough PML, small enough autoshutoff min (provided the simulation time set is much longer and the simulation terminates before reaching 100%).
Â
-
March 1, 2024 at 5:06 pm
Guilin Sun
Ansys EmployeeYou may spend more time on this. However whether it is worth of the time you spend for minor flutuation is for you to justify.Â
You may compare the situation in experiments.
-
March 2, 2024 at 9:03 am
Z.Shahrabifarahani
SubscriberThank you very much for your elaborate explanation.
Â
-
- The topic ‘Fluctuation in transmission’ is closed to new replies.
- Difference between answers in version 2024 and 2017 lumerical mode solution
- Errors Running Ring Modulator Example on Cluster
- Import material .txt file with script
- Trapezoidal ring
- Help for qINTERCONNECT
- Absorption cross-section of AuNR excited by prism-based TIR
- Issues with getting result from interconnent analysis script
- Topology Optimization Error
- How to measure transmission coefficients on a given plane .
- Edge Coupler EME Example Issue
-
1932
-
823
-
599
-
591
-
366
© 2025 Copyright ANSYS, Inc. All rights reserved.