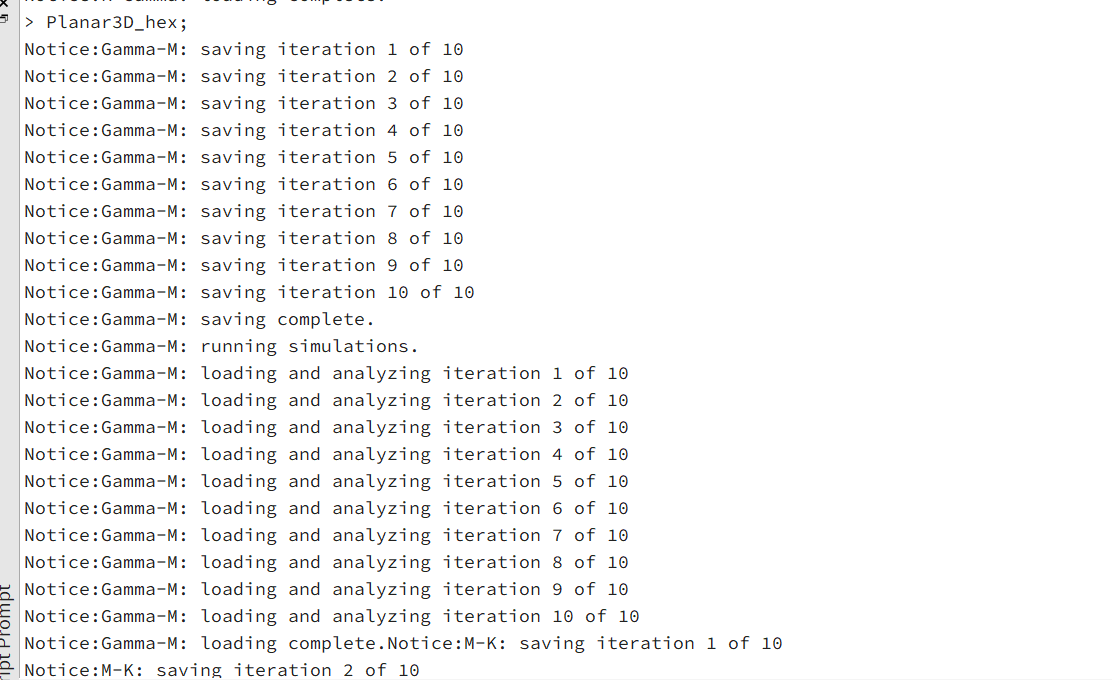
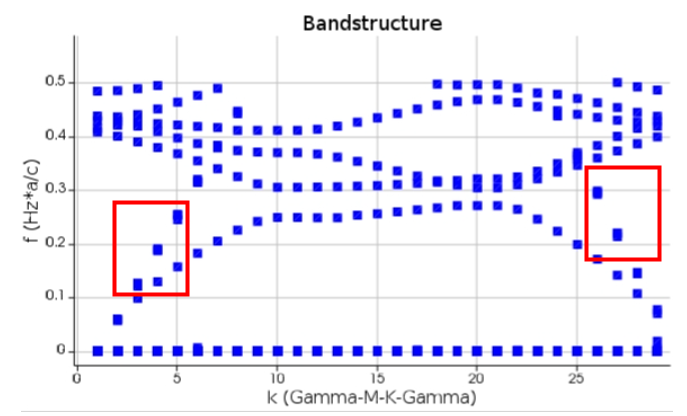
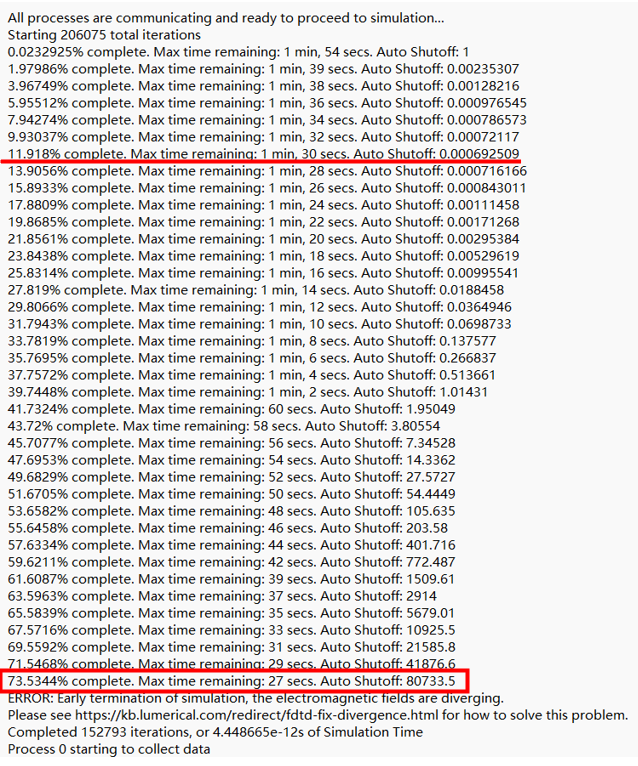
老师您好,在案例“Bandstructure of planar photonic crystal with a hexagonal lattice”中,我使用了如下脚本来计算能带结构,但系统报错。
#############################################################################
# This script combines the results from the Gamma-M-K-Gamma sweep
# and plots the frequency spectrum fs from the bandstructure object
# results over k, and the bandstructure.
# The bandstructure information is extracted using tolerance and num_band
# specified by the user at the beginning of the script.
#
# Properties:
# a: period used to normalize the frequency (f_norm=f*a/c)
# f_band: Frequencies of bands in units of Hz
# f_band_norm: Frequencies of bands in units of Hz * a / c
#############################################################################
# User Defined properties:
tolerance = 1e-3; #tolerance for finding peaks and accepting bands
# setting this too low will result in noisy data where sidelobes of
# peaks are interpreted as new bands
# setting it too high will mean that some bands are not found
num_band = 10; #number of bands to search for in the bandstructure
#
#############################################################################
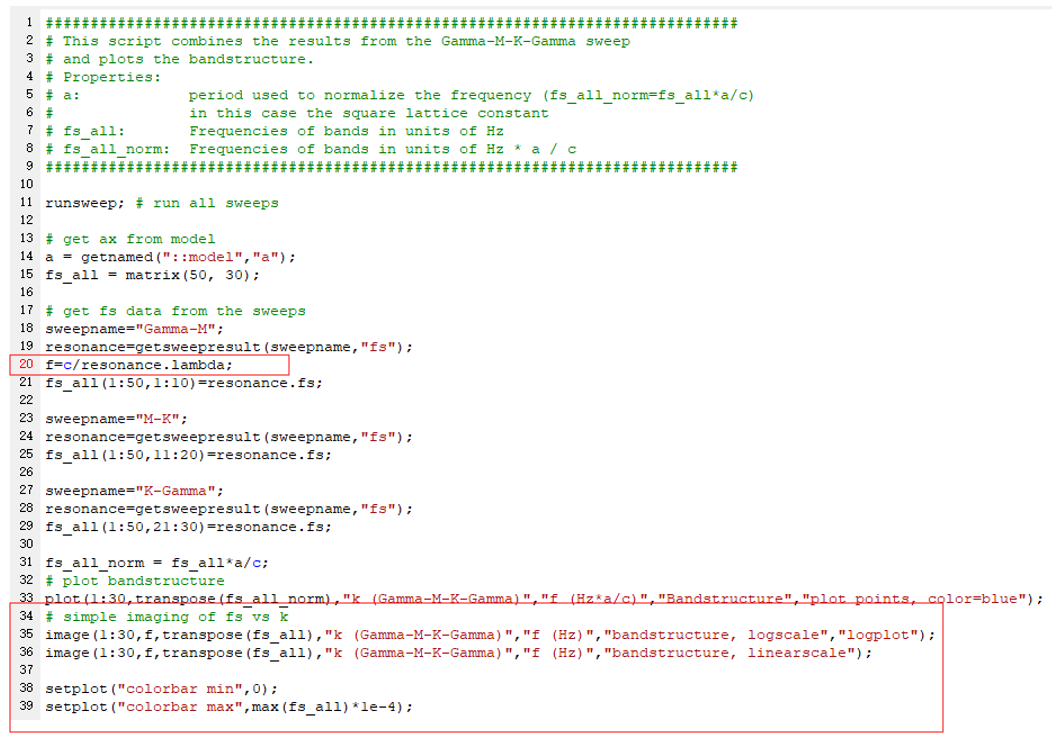
runsweep; # run all sweeps
# get a from model
a = getnamed("::model","a");
# get fs data from the sweeps
sweepname="Gamma-M";
spectrum=getsweepresult(sweepname,"spectrum");
f=c/spectrum.lambda;
fs_all=matrix(length(f),30); # initialize matrix to store fs data in
fs_all(1:length(f),1:10)=spectrum.fs;
sweepname="M-K";
spectrum=getsweepresult(sweepname,"spectrum");
fs_all(1:length(f),11:20)=spectrum.fs;
sweepname="K-Gamma";
spectrum=getsweepresult(sweepname,"spectrum");
fs_all(1:length(f),21:30)=spectrum.fs;
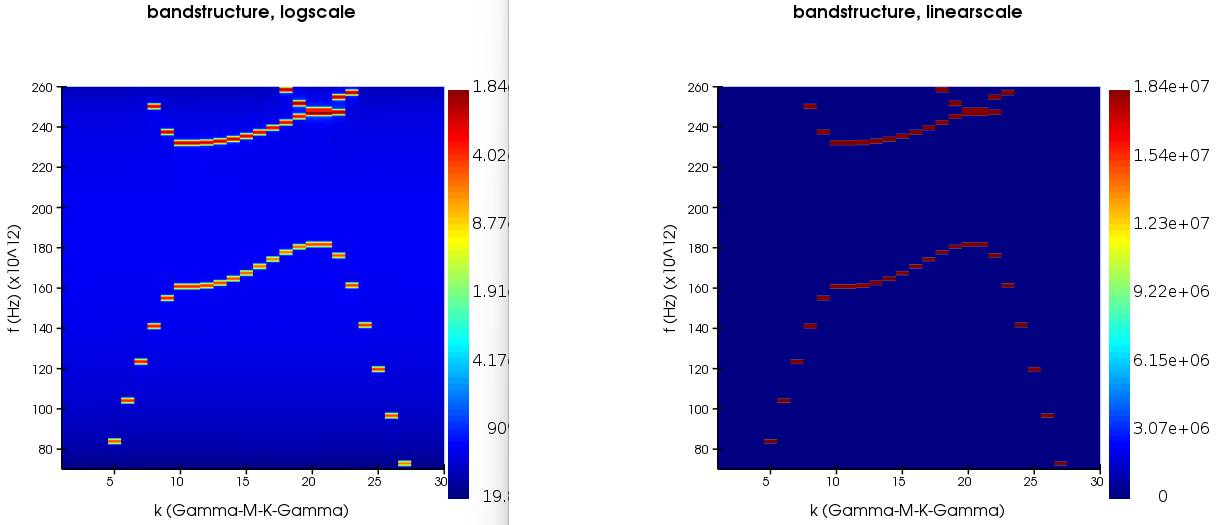
# simple imaging of fs vs k
image(1:30,f,transpose(fs_all),"k (Gamma-M-K-Gamma)","f (Hz)","bandstructure, logscale","logplot");
image(1:30,f,transpose(fs_all),"k (Gamma-M-K-Gamma)","f (Hz)","bandstructure, linearscale");
setplot("colorbar min",0);
setplot("colorbar max",max(fs_all)*1e-4);
# plot bandstructure
bandstructure=matrix(num_band,30); # initialize matrix in which to store band frequency information
# loop over sweep results
for (i=1:30){
#use findpeaks to find num_band number of peaks
temp = findpeaks(fs_all(1:length(f),i),num_band);
#collect data for any peaks that are more than 'tolerance' of the maximum peak (to avoid minor peaks like sidelobes)
minvalue = fs_all(temp(1),i)*tolerance;
f_band=matrix(num_band);
for(bandcount = 1:num_band) {
if( fs_all(temp(bandcount),i) > minvalue) {
f_band(bandcount) = f(temp(bandcount));
}
}
f_band_norm = f_band*a/c; # normalize the frequency vector
bandstructure(1:num_band,i)=f_band_norm;
}
bandstructure=transpose(bandstructure);
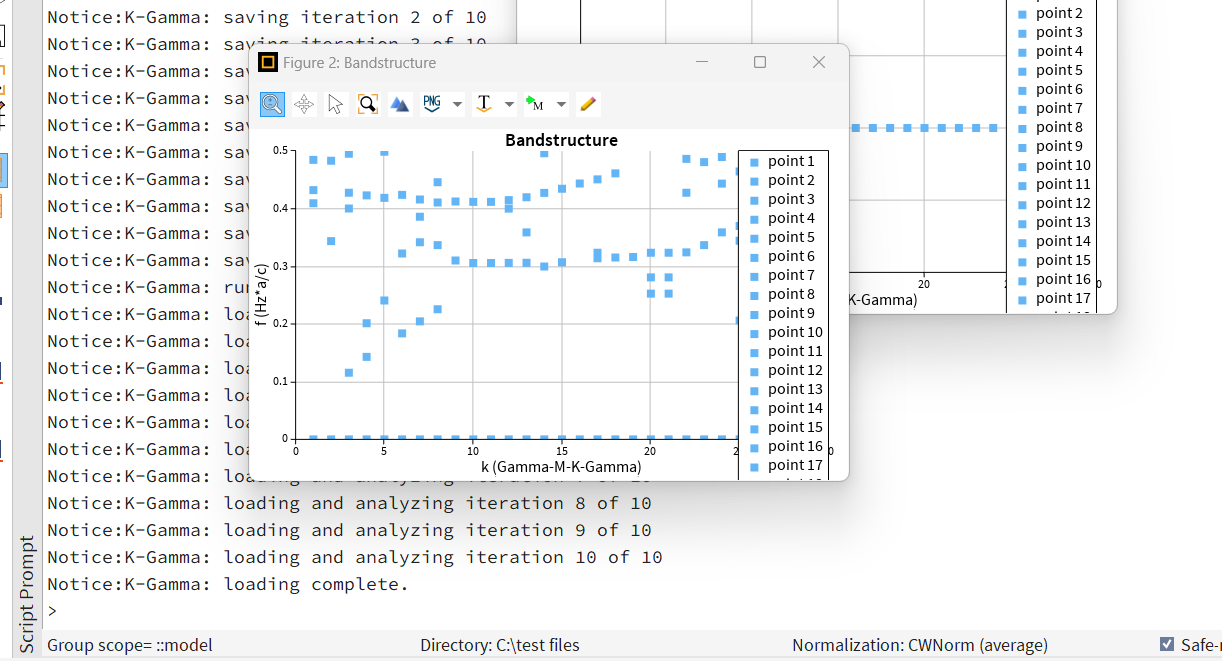
plot(1:30,bandstructure,"k (Gamma-M-K-Gamma)","f (Hz*a/c)","bandstructure","plot points");

请问老师是我设置有什么问题吗?