-
-
July 15, 2024 at 6:58 am
CHEON HYEJUN
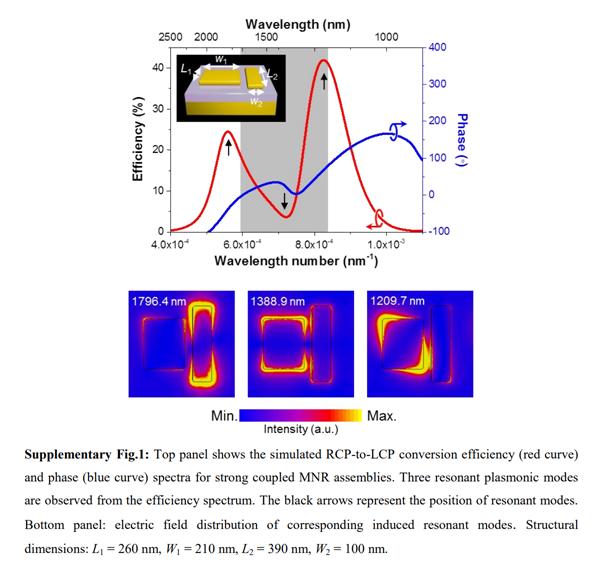
Subscriberhello. I am a beginner in Lumerical FDTD. After implementing the form in the photo below, I would like to obtain the phase data displayed on the graph, but I am not sure how to access it. I asked this question because I was really not sure if there was a function to know the phase right away, or if I had to install a specific monitor on the axis and then receive and convert the data. Sorry for asking such a basic question, but can you explain with an example? ‘Set up the xy monitor and then extract Ey.’ Just explain it once, as if you were explaining it to a child who doesn’t know anything. -
July 17, 2024 at 4:43 pm
Greg Baethge
Ansys EmployeeHi, thank you for posting your question. The answer is not that trivial, there's no direct way to get this information from a monitor. We typically get the amplitude/phase information by calculating the S parameters of the structure. The principle is described in Metamaterial S parameter extraction. We use a dedicated analysis group from the object library for this:
The phase is obtained from angle(S), and the amplitude from abs(S)^2.
-
Viewing 1 reply thread
- The topic ‘Extraction of phase changes due to nanostructure’ is closed to new replies.
Ansys Innovation Space


Trending discussions


Top Contributors


-
3387
-
1052
-
1050
-
886
-
857
Top Rated Tags


© 2025 Copyright ANSYS, Inc. All rights reserved.
Ansys does not support the usage of unauthorized Ansys software. Please visit www.ansys.com to obtain an official distribution.


