TAGGED: an-unknown-error-occured, EME, error, lumerical, Lumerical-EME
-
-
September 8, 2025 at 11:06 pm
shravankruthick.sridhar
SubscriberHi,
I am using Lumerical 2025R2 for an EME S-parameter sweep, and I'm encountering the following error:
"C:\Program Files\Microsoft MPI\Bin\mpiexec.exe" -n 8 -affinity "C:\Program Files\Lumerical\v252\bin\eme-engine-msmpi.exe" -logall -t 1 "C:/Everything/Lumerical Projects/wavefront sensor/Lumerical files/strong_grating_cylinder_mode_convergence_sweep/mode_convergence_sweep_3.lms"

Laptop: Error: there was an unknown parallel error. The error code is 10, the process number is 0
Laptop: Error: there was an unknown parallel error. The error code is 0, the process number is 0
Laptop: Error: there was an unknown parallel error. The error code is 0, the process number is 0
Laptop: Error: there was an unknown parallel error. The error code is 0, the process number is 0
Laptop: Error: there was an unknown parallel error. The error code is 10, the process number is 0
Laptop: Error: there was an unknown parallel error. The error code is 0, the process number is 0
Laptop: Error: there was an unknown parallel error. The error code is 10, the process number is 0
job aborted:
[ranks] message
[0] process exited without calling finalize
[1-7] terminated
---- error analysis -----
[0] on Laptop
C:\Program Files\Lumerical\v252\bin\eme-engine-msmpi.exe ended prematurely and may have crashed. exit code 0xc0000409
---- error analysis ----
==============================================================================================================================================================================================
This crash always happens after the Job Manager says "Completed" as the status. I've tried the following things so far, and none of them fix the error:
- Deleting the
%LOCALAPPDATA%\\Lumericalfolder and the contents of the%TEMP%folder. - Dropping to 1 process and 1 thread in the Resources tab.
- Switching to local computer in Resources → Edit.
- Making a new
.lmsfile with the same structures. - Running another trivial example.
- Reinstalling the 2015-2022 C++ distributable: https://learn.microsoft.com/en-us/cpp/windows/latest-supported-vc-redist?view=msvc-170
- Disabling Microsoft Defender Antivirus
- Checking p0 log file in the sweep folder created by Lumerical: it says simulation successfully completed, but the job detail is as above.
sfc /scannowwith administrator CMD didn’t return any errors.
I see the same message on a different computer. Here's an example:
"C:\Program Files (x86)\IntelSWToolsMPI\compilers_and_libraries_2020.4.321\windows\mpi\intel64\bin\mpiexec.exe" -n 1 -localroot -noprompt "C:\Program Files\Lumerical\v242\bin\eme-engine.exe" -t 64 "path/to/file.lms"

===================================================================================
= BAD TERMINATION OF ONE OF YOUR APPLICATION PROCESSES
= RANK 0 PID 42868 RUNNING AT DESKTOP-92MNHSK
= EXIT STATUS: -1073740791 (c0000409)
===================================================================================

Warning: Process exited with exit code -1
I'd greatly appreciate help in fixing this issue. Thanks in advance!
- Deleting the
-
September 9, 2025 at 5:42 pm
Lito
Ansys Employee- Please try/download the EME example file from >> Bragg Grating full device simulation with EME – Ansys Optics
- Save this into the local SSD drive on your computer.
- Try to run using the default settings/resource configuration:
- Delete "MODE Solutions.ini"
del %AppData%\Lumerical\"MODE Solutions.ini"
- Reboot the computer
- Delete "MODE Solutions.ini"
- Open and run the example step #1 above.
- Do not change anything on the Resources configuration.
This would be difficult for us to debug/fix since we were unable to reproduce the issue on our Windows machines. We run the above example using the default settings; Microsoft MPI on Lumerical 2025 R2.1. Simulation log file shown below.
Checked out feature at start: 'eme_engine'
Checked out HPC license feature: 'eme_engine'
Checked in feature: 'lum_eme_solve'
Ansys Lumerical 2025 R2.1 Eigenmode Expansion Solver Version 7.26.4214 (Windows 64bit)
 expires (month/day/year): 11/20/2025
using config file: Ansys Licensing set with ANSYSLMD_LICENSE_FILE
license host: 1055@localhost
current time: Tue Sep 9 10:29:28 2025
Running on host:
All processes are communicating and ready to proceed to simulation...
Detected 20 processes on 1 host
This process is the local leader
Running lms file: C:\Program Files\Lumerical\v252\bin\eme-engine-msmpi.exe -t 1 -remote -shared-solve-license == D:/a_Support/#ALF/issue with eme/Bragg_EME.lms
Sharing project file with 19 peer processes on this host
All processes are communicating and ready to proceed to simulation...
Running MODE Simulation
Starting simulation
Starting meshing
Simulation size in gridpoints: 1 x 53 x 81
Refined 0 mesh cells (0.000000%)
Completed meshing!
Meshing complete in 0.046875 seconds of CPU time
Starting meshing
Simulation size in gridpoints: 1 x 53 x 81
Refined 0 mesh cells (0.000000%)
Completed meshing!
Meshing complete in 0.000000 seconds of CPU time
Starting meshing
Simulation size in gridpoints: 1 x 53 x 81
Refined 0 mesh cells (0.000000%)
Completed meshing!
Meshing complete in 0.000000 seconds of CPU time
All processes are communicating and ready to proceed to simulation...
Starting meshing
Simulation size in gridpoints: 1 x 53 x 81
Refined 0 mesh cells (0.000000%)
Completed meshing!
Meshing complete in 0.000000 seconds of CPU time
Starting meshing
Simulation size in gridpoints: 1 x 53 x 81
Refined 0 mesh cells (0.000000%)
Completed meshing!
Meshing complete in 0.000000 seconds of CPU time
Starting meshing
Simulation size in gridpoints: 1 x 53 x 81
Refined 0 mesh cells (0.000000%)
Completed meshing!
Meshing complete in 0.000000 seconds of CPU time
Starting meshing
Simulation size in gridpoints: 1 x 53 x 81
Refined 0 mesh cells (0.000000%)
Completed meshing!
Meshing complete in 0.000000 seconds of CPU time
Starting meshing
Simulation size in gridpoints: 1 x 53 x 81
Refined 0 mesh cells (0.000000%)
Completed meshing!
Meshing complete in 0.000000 seconds of CPU time
Starting meshing
Simulation size in gridpoints: 1 x 53 x 81
Refined 0 mesh cells (0.000000%)
Completed meshing!
Meshing complete in 0.000000 seconds of CPU time
EME simulation time (s): 3.893546
Number of processes: 20
Warning: Number of processes in resource configuration exceeded number of EME cells. Only 2 processes used in simulation.
Time to normalize fields and orthogonalize degenerate modes:  0.140975
Time to calculate modes: 0.871727
Time to calculate overlaps: 2.837527
Total communication time: 0.140556
Peak memory used by the engine: 154385 kB
Simulation completed successfully at: Tue Sep 9 10:29:33 2025
Overall EME run time (s): 6.06835 - Please try/download the EME example file from >> Bragg Grating full device simulation with EME – Ansys Optics
-
September 24, 2025 at 10:34 pm
shravankruthick.sridhar
SubscriberHi Lito,
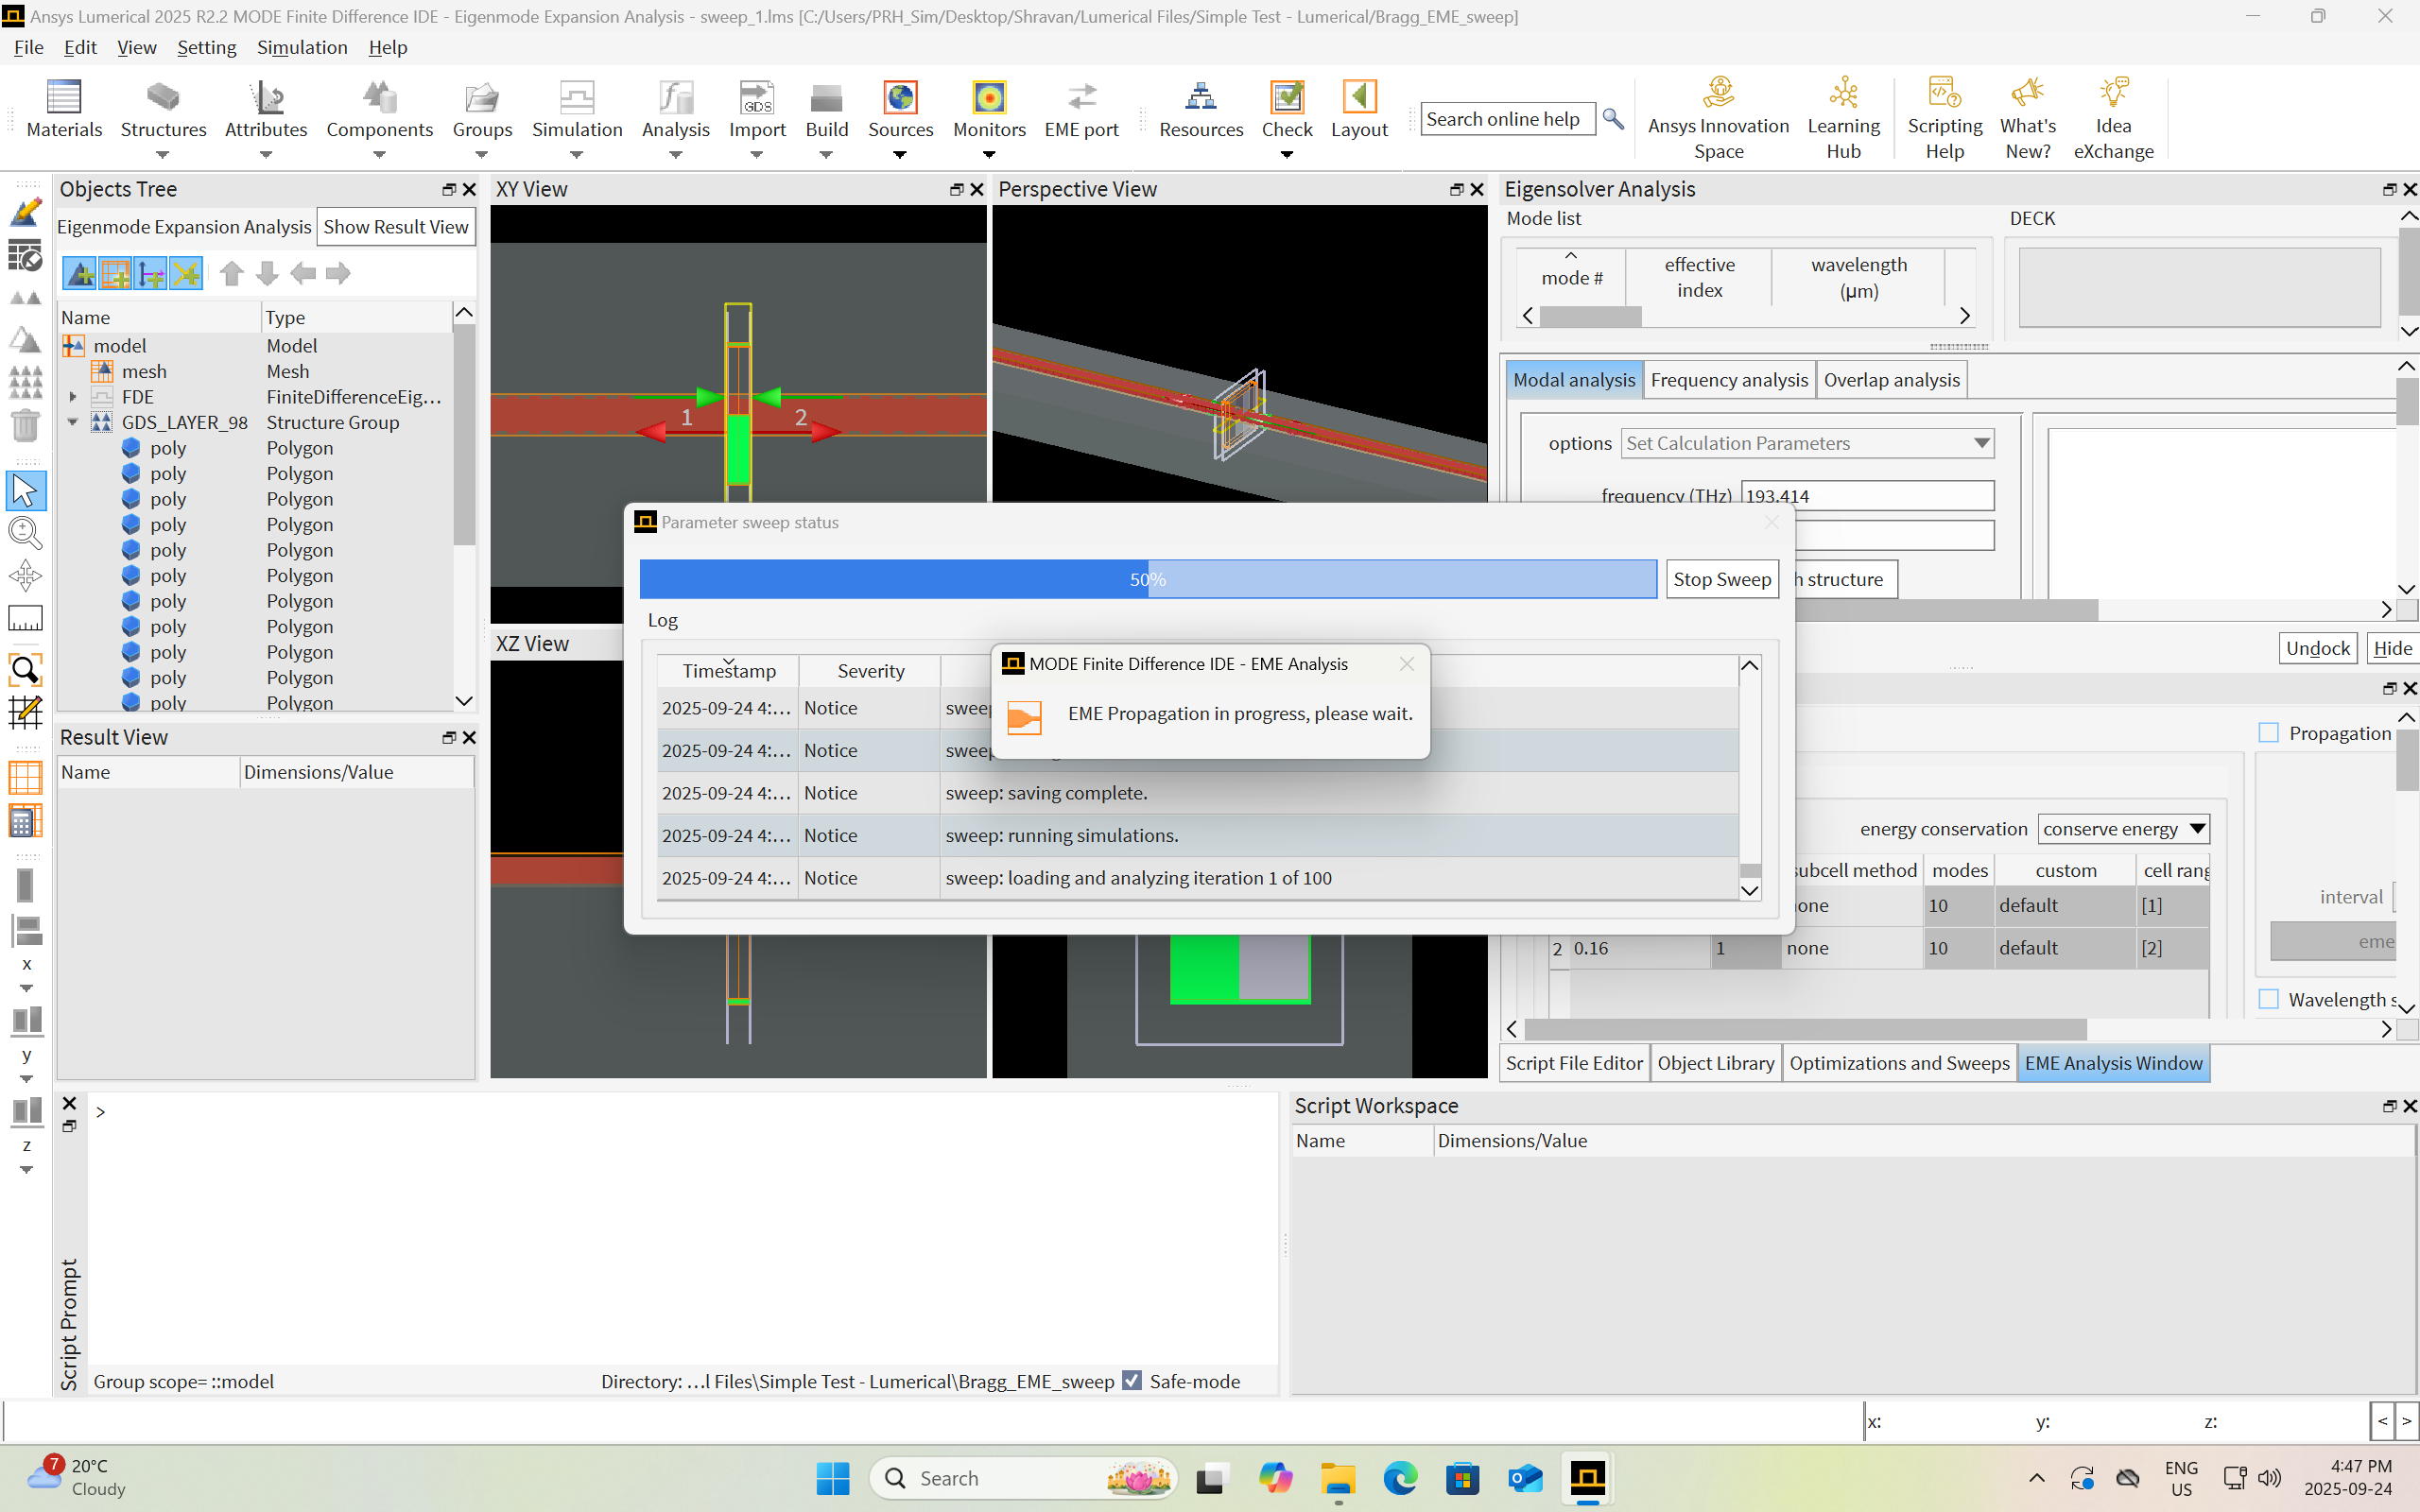
I tried what the simple Bragg grating example, and I’ve been seeing the following message with the status stuck at “loading and analyzing iteration 1 of 100” for over an hour. For reference, all 100 wavelength points finished simulating in 5 minutes, and the “EME propagation in progress” message does not show up in version 24.2.
Edit: I let it run for 5+ hours and it was still stuck on the exact same screen as shown.
-
September 26, 2025 at 3:37 pm
Lito
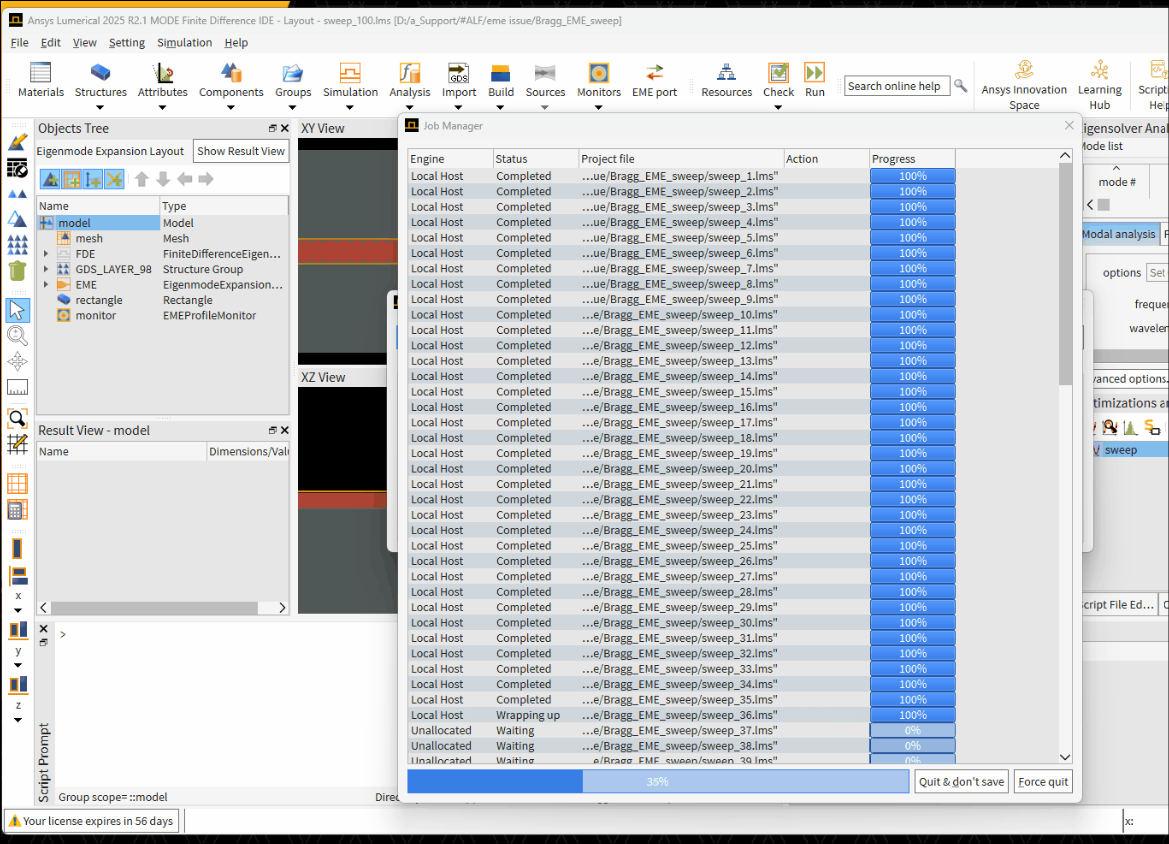
Ansys EmployeeSorry, as mentioned we were unable to reproduce the issue on any of our machines. We can run the example simulation/sweep to completion as per the screenshot below.
- Are you running third party antivirus/security software on your PCs? This could affect when running simulations with MPI.
- Have you tried the options on my previous post/message?
- Delete the MODE Solutions.ini file before running the sweeps/simulation? This is important especially if you are running/switching between different versions of Lumerical.
del %AppData%\Lumerical\"MODE Solutions.ini"
- Try to run using "Local Computer" as the 'Job launching preset' or a different MPI as mentioned in the Knowledge Base (KB) FAQ >> Fixing Lumerical engine or run time errors – Ansys Optics
-
September 26, 2025 at 5:49 pm
shravankruthick.sridhar
SubscriberHi Lito,
Thanks for the reply.
I'm no longer facing the 0xc0000409 exit code error, and the Job Manager says that all 100 simulations run to completion, but Lumerical still gets stuck on the "EME propagation in progress" after this, when the Job Manager window closes and the "Parameter sweep status" window updates itself with "loading and analyzing iteration 1 of 100" (as shown on my previous reply's screenshot). As per your suggestions, I did all of the following before attempting to re-run the example:
- deleted %AppData%\Lumerical\MODE Solutions.ini
- rebooted my computer
- disabled the antivirus (Windows' default - Microsoft Defender)
- Switched to "Local Computer" for the "Job Launching Preset"
After all these attempts, Lumerical still gets stuck at "EME propagation in progress" screen.
-
September 29, 2025 at 5:43 pm
Lito
Ansys EmployeeTry running a different example simulation/sweep to verify if the issue is happening to all simulations/models. It could be an issue with the simulation/sweep itself.
-
September 29, 2025 at 8:12 pm
shravankruthick.sridhar
SubscriberI tried running the fbg.lms file without changing anything in version 25.2 from the following webpage: https://optics.ansys.com/hc/en-us/articles/360042303654-Fiber-Bragg-gratings. It ran properly, with the "Status" in the job manager showing "Completed". But when I right-clicked and pressed "View Job Details", I saw the error code 0xc0000409 with the message:
C:\Program Files\Lumerical\v252\bin\eme-engine-msmpi.exe ended prematurely and may have crashed. exit code 0xc0000409However, the output S-matrix plot matched the one shown on the webpage.
It appears that the simulation hangs at "EME propagation in progress" if the MPI does not give exit code 0xc0000409. Why is this happening?
-
October 1, 2025 at 10:30 pm
Lito
Ansys EmployeeAs mentioned, we cannot reproduce the error/issue on any of our Windows machines. We are not sure what is happening on your system. Try running with a different MPI or without MPI. And if you are switching between different versions of Lumerical, ensure to shutdown/terminate all running Lumerical applications or reboot the machine and then delete the Lumerical product preference.ini file, before running a different version. Otherwise, delete the Lumerical product preference.ini file and only have 1 version installed/running on the machine then reboot the machine after uninstalling the older versions.
-
- You must be logged in to reply to this topic.


-
5824
-
1906
-
1420
-
1305
-
1021

© 2026 Copyright ANSYS, Inc. All rights reserved.


