TAGGED: field-time-monitor, frequency-domain, monitor, normalization
-
-
July 16, 2024 at 6:13 am
Debasish Biswasray
SubscriberHi there,
I am using the Frequency-domain field and power monitor to extract the near electric field distribution plot. However, I am not sure whether the results give the values of electric field normalized to the incident source field or not. In other words, if the electric field of the source is E0, whether the field shown in frequency-domain monitor data is E/E0 or simply E?
In the visualization window (as shown in the image below), however, I can only see the options for attribute 'E'. Is it normalized to the source field?
Please help me understant the concept.
Thank you in advance.
-
July 18, 2024 at 8:45 am
Greg Baethge
Ansys EmployeeHi Debasish, thank you for posting your question. The fields recorded by frequency domain monitors are normalized to the source spectrum (see this page), but not to the source amplitude. For sources like plane wave or beams, the default source amplitude is set to 1 V/m (defining the amplitude of the electric field), and can be changed in the source settings. If you change it, you will see this affecting the field amplitude recorded by the monitors.
-
July 18, 2024 at 9:23 am
Debasish Biswasray
SubscriberThank you Greg for clarifying the doubt.
-
- The topic ‘
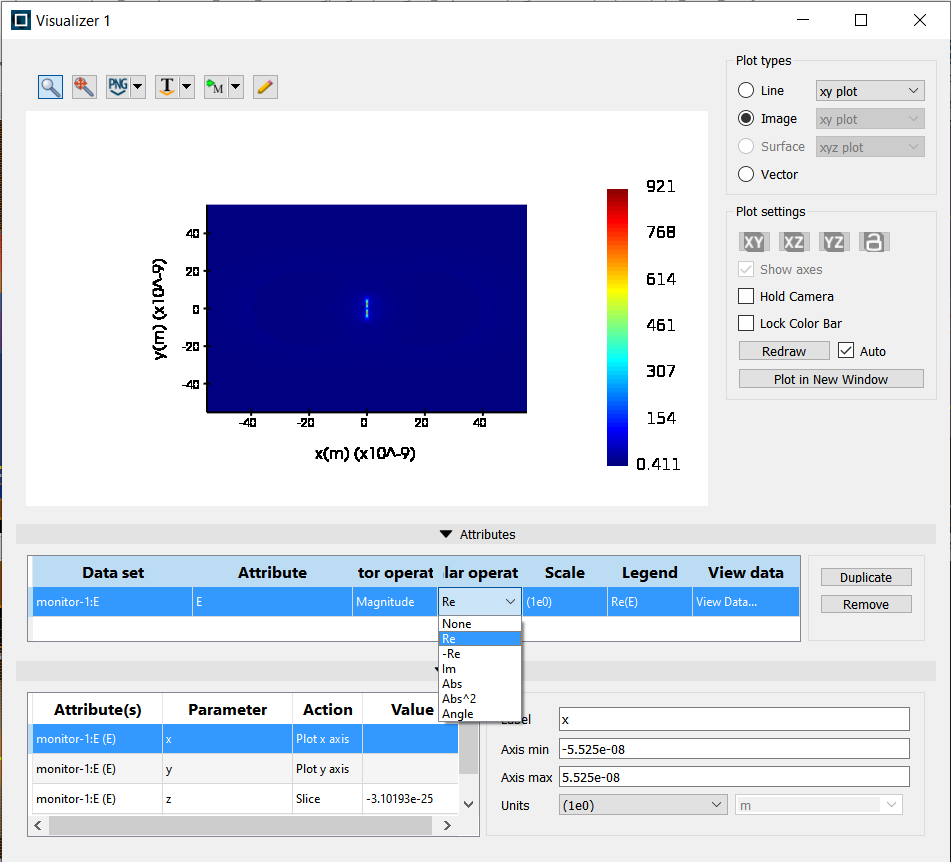
Electric field from Frequency-domain monitor’ is closed to new replies.
- Import material .txt file with script
- Errors Running Ring Modulator Example on Cluster
- Absorption cross-section of AuNR excited by prism-based TIR
- How to measure transmission coefficients on a given plane .
- TE Polarization Fraction + Waveguide TE/TM Fraction
- Edge Coupler EME Example Issue
- Lumerical Python API Topology Optimization Error 2025 R1
- 2D inverse design grating coupler
- FDE : Simulation waveguides with electrodes
- Loss of lithium niobate phase modulator
-
2262
-
925
-
599
-
591
-
497
© 2025 Copyright ANSYS, Inc. All rights reserved.