-
-
November 7, 2024 at 3:31 pm
suruchi.bala
SubscriberHi,
How to overlap the structure of waveguide with the EF mode profile generated through field profile monitor?
I want to show the structure and mode profile all together in the same plot. Is there a direct option?
Â
Â
-
November 7, 2024 at 7:24 pm
Guilin Sun
Ansys Employee
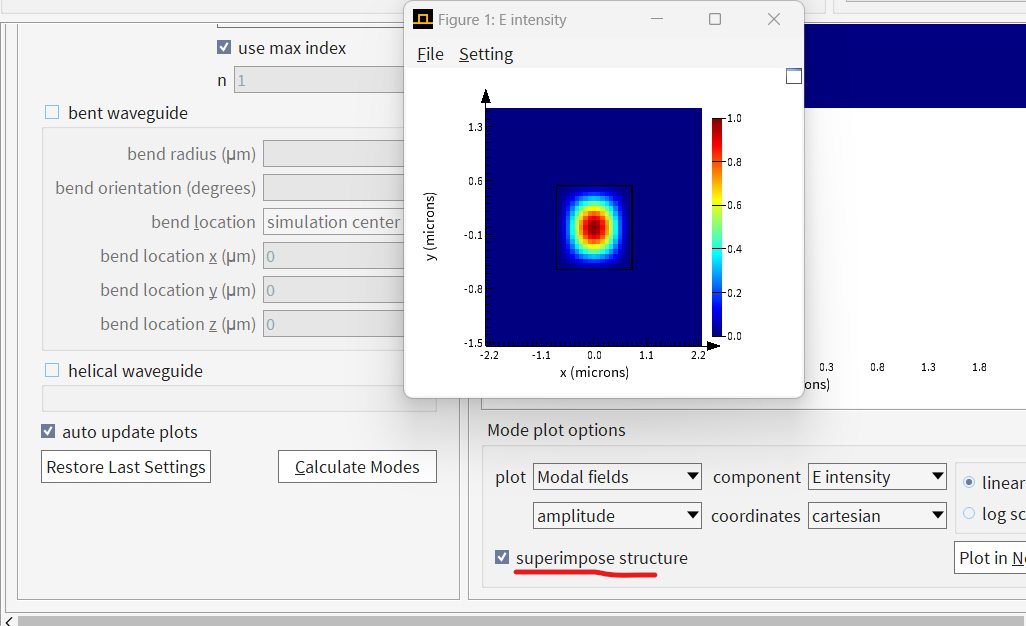
If this is FDE, you can choose the option:
for FDTD, there is a simple example: https://optics.ansys.com/hc/en-us/articles/360034395154-Tip-for-adding-structure-outlines-to-field-plots
You may also try to plot contours without structure:https://optics.ansys.com/hc/en-us/articles/360045175973-getcontour-Script-command
Or you may use other 3rd party to have better visual effect.
-
November 7, 2024 at 7:44 pm
suruchi.bala
SubscriberSure, thank you.
-
Viewing 2 reply threads
- You must be logged in to reply to this topic.
Ansys Innovation Space
Trending discussions
- Difference between answers in version 2024 and 2017 lumerical mode solution
- Import material .txt file with script
- Absorption cross-section of AuNR excited by prism-based TIR
- How to measure transmission coefficients on a given plane .
- TE Polarization Fraction + Waveguide TE/TM Fraction
- Edge Coupler EME Example Issue
- 2D inverse design grating coupler
- Lumerical Python API Topology Optimization Error 2025 R1
- FDE : Simulation waveguides with electrodes
- Loss of lithium niobate phase modulator
Top Contributors
-
2577
-
933
-
792
-
599
-
591
Top Rated Tags
© 2025 Copyright ANSYS, Inc. All rights reserved.
Ansys does not support the usage of unauthorized Ansys software. Please visit www.ansys.com to obtain an official distribution.