-
-
August 20, 2024 at 9:41 pm
ZenerDalf
SubscriberHi I was wondering if this issue has happened to anyone. I am currently trying to gather some E-field values along a line in my simulation.
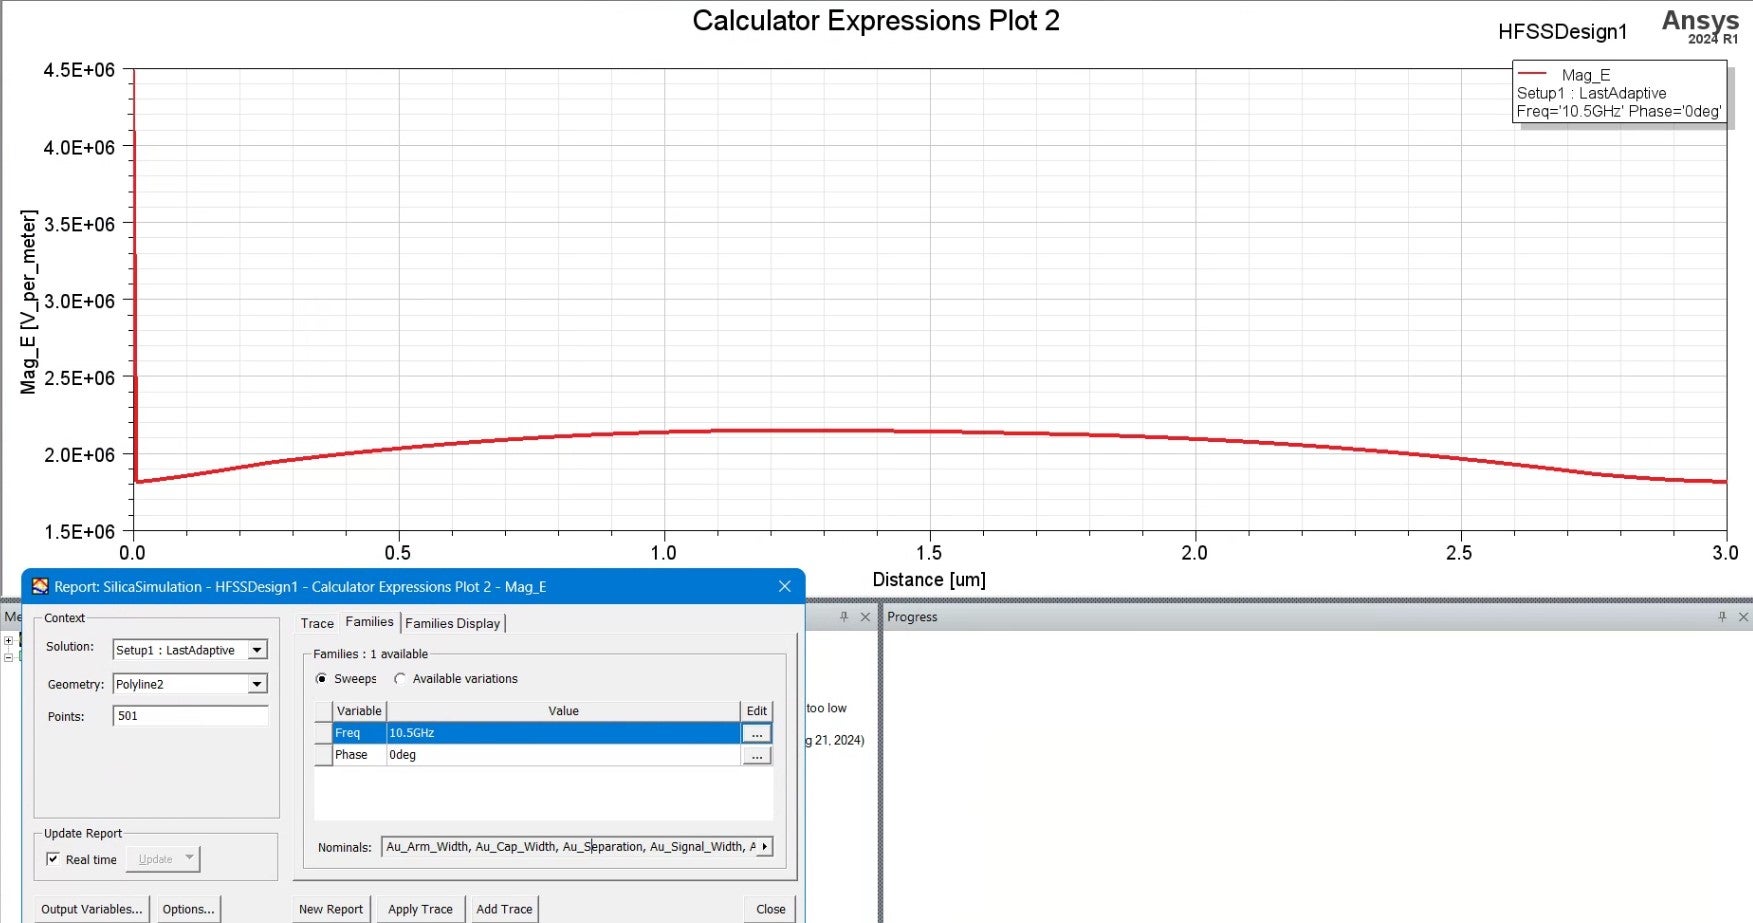
This was easily done by drawing a line through my region of interest and plotting the E-field magnitude along the line. The issue is that the distance plot on the x axis does not correspond to the length of the line that was drawn. Any help would be appreciated.
-
August 21, 2024 at 2:59 pm
Praneeth
Forum ModeratorHi Lucio,
Thank you for reaching out to the Ansys learning forum.
Please check what is selected as the primary sweep in the report dialog window. Do share screenshot of the report dialog window to help us serve you better.
Best regards,
Praneeth. -
August 22, 2024 at 3:15 am
ZenerDalf
SubscriberHi Praneeth,
thank you for the response. I have attached some screenshots of the issue I am talking about.
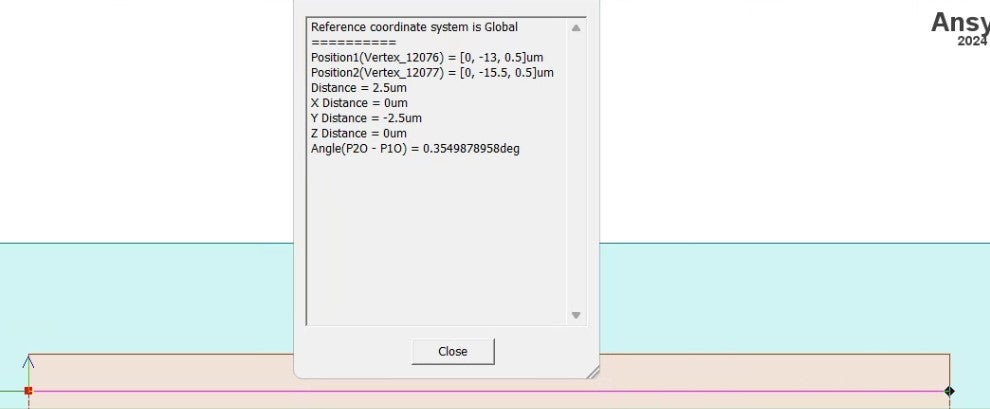
The first screenshot shows the line I have drawn which corresponds to 2.5um in length and the second screenshot shows how I extract the magnitude E-field values along the line. Red flags were raised when the plot showed the x-axis extending to 3um as opposed to what was intended, 2.5um.
If any more information is needed please let me know.
-
August 27, 2024 at 7:21 am
Praneeth
Forum ModeratorHi,
Thank you for sharing the screenshots.
Please share the screenshot of the report dialog window with the Trace context selected. It looks like you have more than one polyline defined. Kindly check if you selected the correct one.
Best regards,
Praneeth.
-
- You must be logged in to reply to this topic.


-
3407
-
1057
-
1051
-
896
-
882

© 2025 Copyright ANSYS, Inc. All rights reserved.


