

-
-
September 21, 2020 at 10:44 am
Pluto922
SubscriberSeptember 21, 2020 at 12:42 pmRob
Forum ModeratorLook at the display range, if you set the first image range to 0 to 1e-2 I suspect you'll see something like the third image. nSeptember 23, 2020 at 3:28 amSubscriber Figure 1. Auto Range is selected of the DPM conc.n
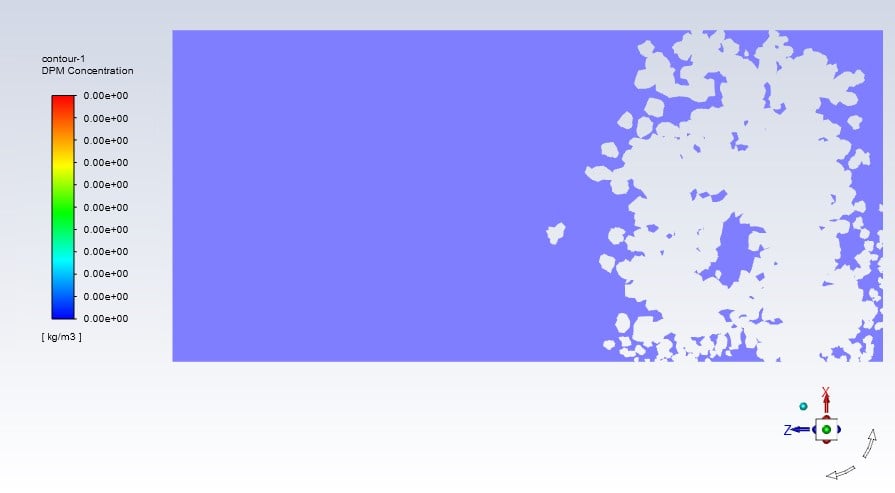
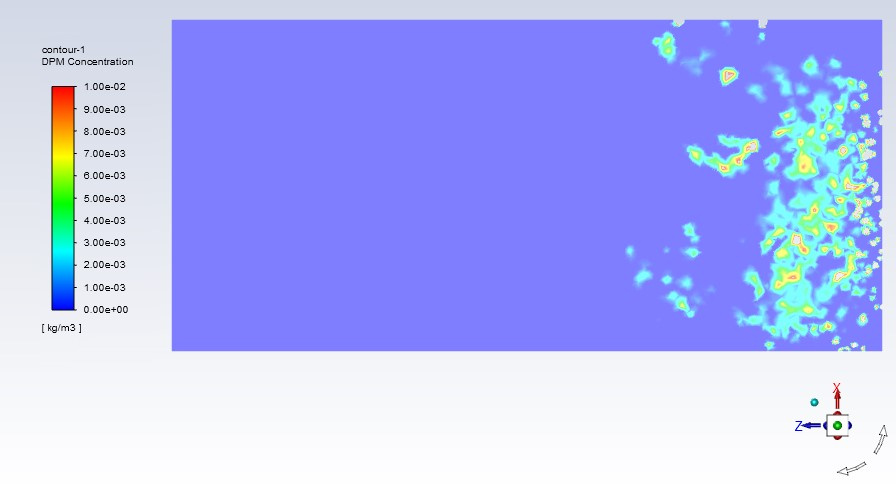 Figure 2. Clip to Range is selected and Min 0 to Max 0.01 of the DPM conc.nOh, Rob, you are right. nBut there are some tiny gap in figure2. And what is worng in figure1, why the DPM conc not displayed ?n
September 23, 2020 at 2:37 pmForum ModeratorThe holes in Fig 2 are regions where you've clipped the display range: if you turn off clip to range you'll see those areas in red: they're regions with a value higher than 1e-2 kg/m3. nFig 1 is displaying the concentration, it's just the bulk of your region has a concentration under 1.7e-2 kg/m3 with the revised scale in Fig 2 you can see it.Viewing 3 reply threads
Figure 2. Clip to Range is selected and Min 0 to Max 0.01 of the DPM conc.nOh, Rob, you are right. nBut there are some tiny gap in figure2. And what is worng in figure1, why the DPM conc not displayed ?n
September 23, 2020 at 2:37 pmForum ModeratorThe holes in Fig 2 are regions where you've clipped the display range: if you turn off clip to range you'll see those areas in red: they're regions with a value higher than 1e-2 kg/m3. nFig 1 is displaying the concentration, it's just the bulk of your region has a concentration under 1.7e-2 kg/m3 with the revised scale in Fig 2 you can see it.Viewing 3 reply threads- The topic ‘DPM Concentration on Auto Range or Clip to Range in Contours in Fluent’ is closed to new replies.
Innovation Space Trending discussions
 Top Contributors
-
peteroznewman
 4763
4763 -
scabo
 1565
1565 -
Dennis Chen
 1386
1386 -
javat33489
 1242
1242 -
Shyam Prasad V Atri
1021
Top Rated Tags
© 2026 Copyright ANSYS, Inc. All rights reserved.
Ansys does not support the usage of unauthorized Ansys software. Please visit www.ansys.com to obtain an official distribution.
-


The Ansys Learning Forum is a public forum. You are prohibited from providing (i) information that is confidential to You, your employer, or any third party, (ii) Personal Data or individually identifiable health information, (iii) any information that is U.S. Government Classified, Controlled Unclassified Information, International Traffic in Arms Regulators (ITAR) or Export Administration Regulators (EAR) controlled or otherwise have been determined by the United States Government or by a foreign government to require protection against unauthorized disclosure for reasons of national security, or (iv) topics or information restricted by the People's Republic of China data protection and privacy laws.


