
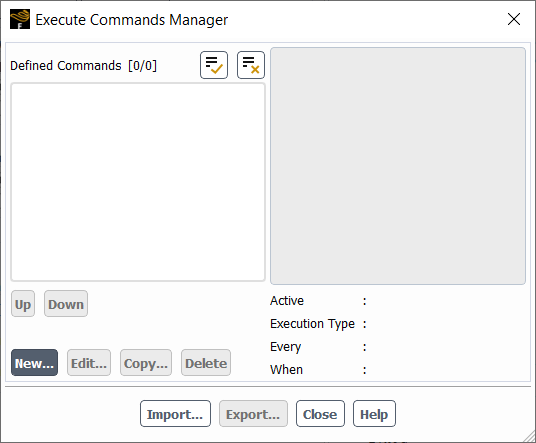
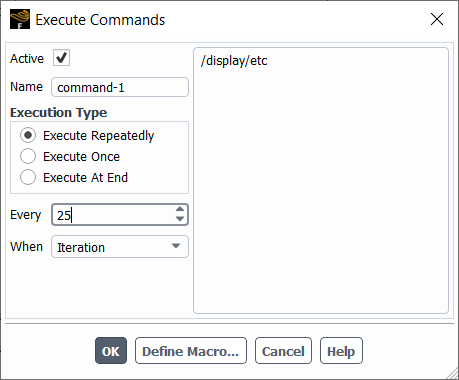
Display Contour Plot every 25 time-steps During Calculation


Viewing 5 reply threads
- The topic ‘Display Contour Plot every 25 time-steps During Calculation’ is closed to new replies.


