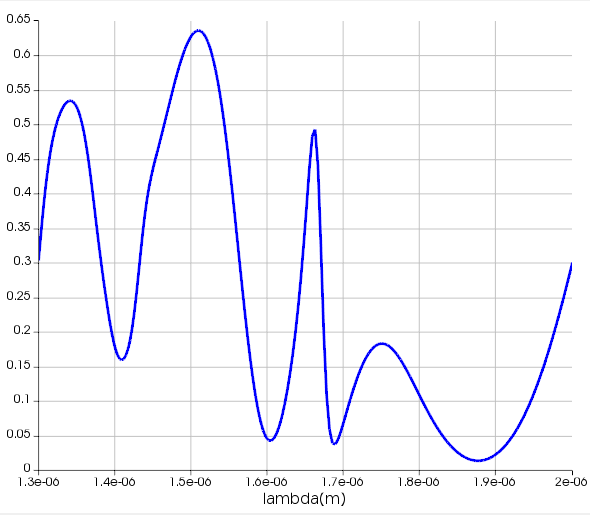
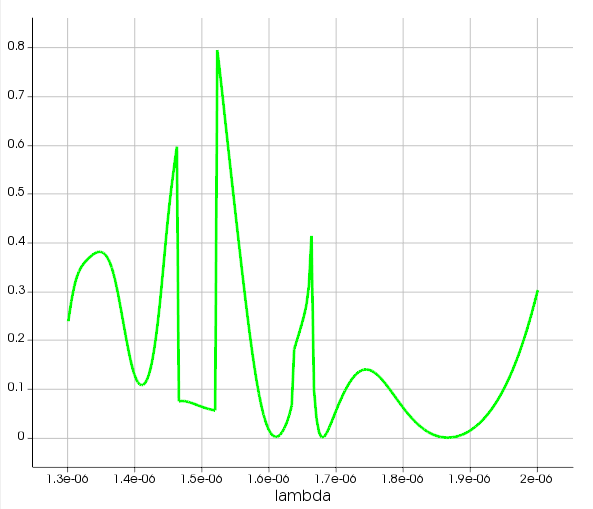
-
-
November 20, 2024 at 9:44 am
ph23resch01002
SubscriberDear Sir/Madam,Â
I have used the s params analysis group, to calculate the s and s polarization and transmission coefficients. When I use the transmission monitor, I get a plot as shown below
Then, I have used the result S from the s_params analysis group to calculate the T for the x polarised incidence. I have done the abs(s12)^2, I got the following plot,Â
As far as I know, if we have to measure the transmission coefficients, we must do the abs(S_12)^2. But why do I get such a discrepancy? Can you shed some light on it?
Thank you.ÂÂ
-
November 20, 2024 at 6:01 pm
Amrita Pati
Ansys EmployeeHi,
Yes, I believe the results should be the same. Is the resolution of data/number of points used to plot the graph in both cases same?
Regards,
Amrita
-
Viewing 1 reply thread
- You must be logged in to reply to this topic.
Ansys Innovation Space
Trending discussions
Top Contributors
-
3487
-
1057
-
1051
-
955
-
917
Top Rated Tags
© 2025 Copyright ANSYS, Inc. All rights reserved.
Ansys does not support the usage of unauthorized Ansys software. Please visit www.ansys.com to obtain an official distribution.