-
-
February 1, 2019 at 3:27 am
Mohamed Abu-bakr
SubscriberI am simulating flow in a pipe and constant uniform heat flux, I choose to module liquid (Fluid) without pipe(Hollow tube), When I calculate the temperature at the liquid surface using chart the values are different from what I have noticed on the contour. Also, I have used the probe at the values are similar to chart and different from the contour however the values on the contour is the correct one.Â
The values on the contours are around 306.762 K toward the outlet as shown the following figureÂ
and from the chart, it is around 295.5 as shown in the following figureÂ
The full project file is available on the following link: https://drive.google.com/open?id=1qnVJjSBAsOhjpc5VYB5EOYGq0Tdc5kqP
-
February 1, 2019 at 9:49 am
Rob
Forum ModeratorANSYS staff can't download files or attachments, so we'll need a few more pictures.Â
Please can you plot the line on the contour plot too? Also plot the mesh so we can see the resolution.Â
-
February 1, 2019 at 11:14 am
-
February 1, 2019 at 1:19 pm
Rob
Forum ModeratorWhat are your wall boundary settings in CFX?Â
Please create a new line that runs up the centre of the domain and plot that: I suspect the results will be very similar.Â
-
February 1, 2019 at 1:45 pm
Mohamed Abu-bakr
SubscriberMy wall BC are as shownÂ
The chart and the contour actually show the same result at the center.
The temperature in the pipe core is constant and equal to the inlet condition 293 K as the thermal boundary layer is smaller compared to the 60 mm diameter.
This is the line relative to the plot (again in black)
And this the chart
-
February 1, 2019 at 4:57 pm
Rob
Forum ModeratorCan you refine the near wall mesh and continue the run: looking at the image of mesh & temperature contour it looks like only the near wall cell is warm.Â
-
February 4, 2019 at 12:34 am
Mohamed Abu-bakr
SubscriberSorry but the solution seems to be temporary when I made another mesh for different turbulence model the problem occurred again. Â
-
February 4, 2019 at 1:17 am
-
February 4, 2019 at 2:08 am
-
February 4, 2019 at 10:47 am
Rob
Forum ModeratorHow's the convergence?Â
-
February 4, 2019 at 12:04 pm
Mohamed Abu-bakr
SubscriberAll residual are below 10e-7 and Energy is below 10e-7. Also I am monitoring the average wall temperature and it doesn't change much by the end of the run however it is wrong.
-
February 4, 2019 at 1:22 pm
Rob
Forum ModeratorAnd if you plot everything in Fluent with node values deselected?Â
-
February 4, 2019 at 3:05 pm
-
February 4, 2019 at 3:33 pm
Rob
Forum ModeratorOK, so Fluent is consistent - that's the main thing to clarify.Â
Fluent is a cell based solver and CFX is node based. CFD Post is what was CFX Post so when data is transferred across from Fluent there is some interpolation of the data: the different is usually negligible. I tend to use Fluent for all numerical reporting and CFD Post for images: the latter is becoming rarer as Fluent's graphics are improved.Â
-
February 4, 2019 at 4:17 pm
Mohamed Abu-bakr
SubscriberCFD post with fluent is giving good results.
But CFD post of CFX is what seems to fail.
I have noticed that for CFX results in CFD post
When I change variables from conservative to hybrid it gives better valuesÂ
However based my understanding of this: https://www.sharcnet.ca/Software/Ansys/16.2.3/en-us/help/cfx_ref/i1298886.htmlÂ
The opposite should be the case. -
February 4, 2019 at 5:02 pm
Rob
Forum ModeratorI'll ask a colleague: I don't use CFX enough to be able to answer reliably.Â
-
- The topic ‘
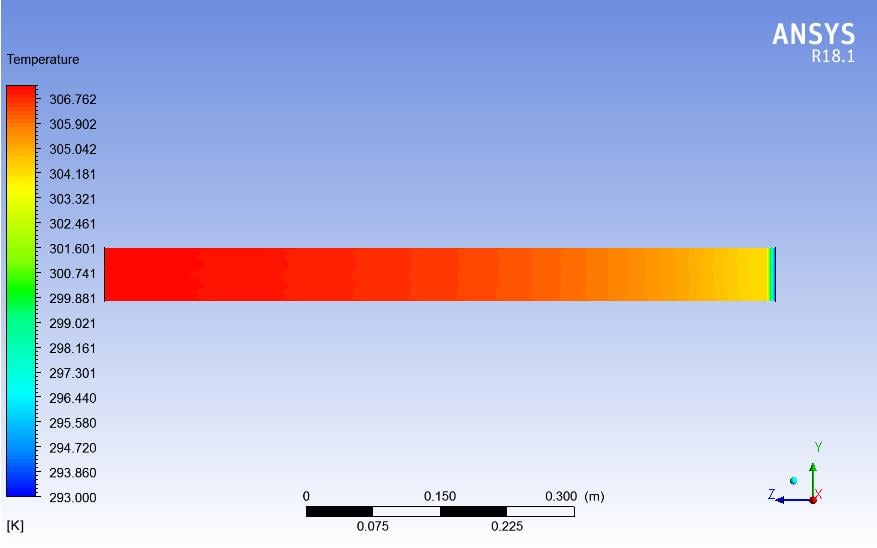
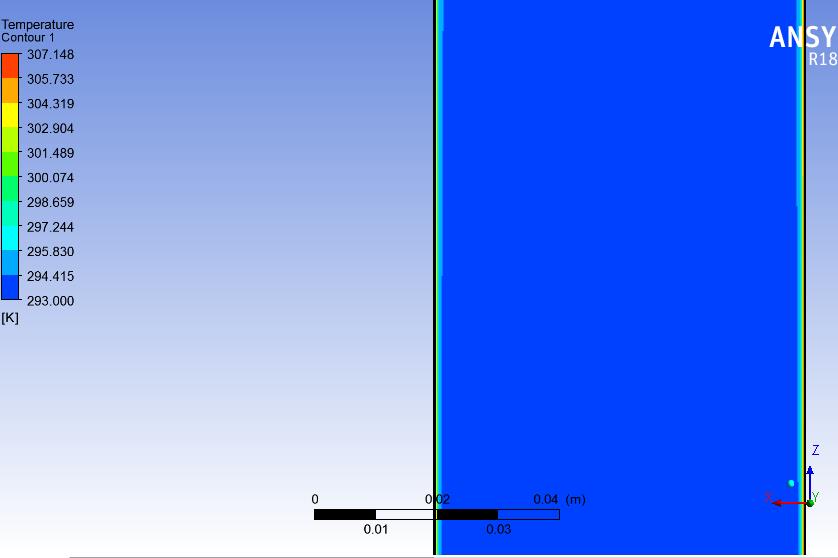
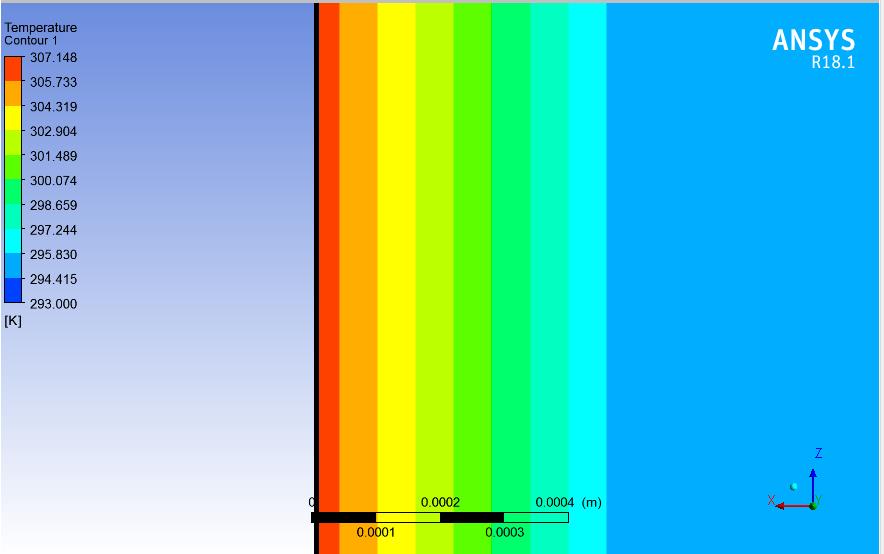
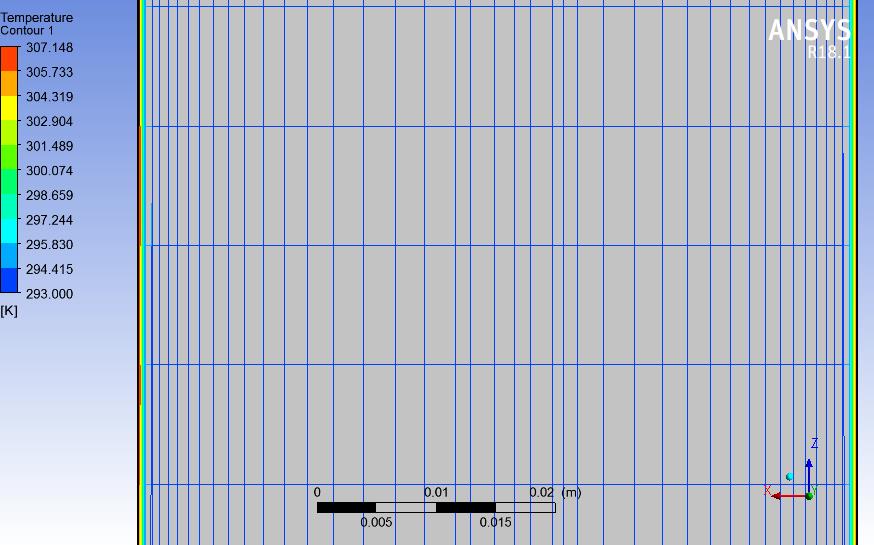
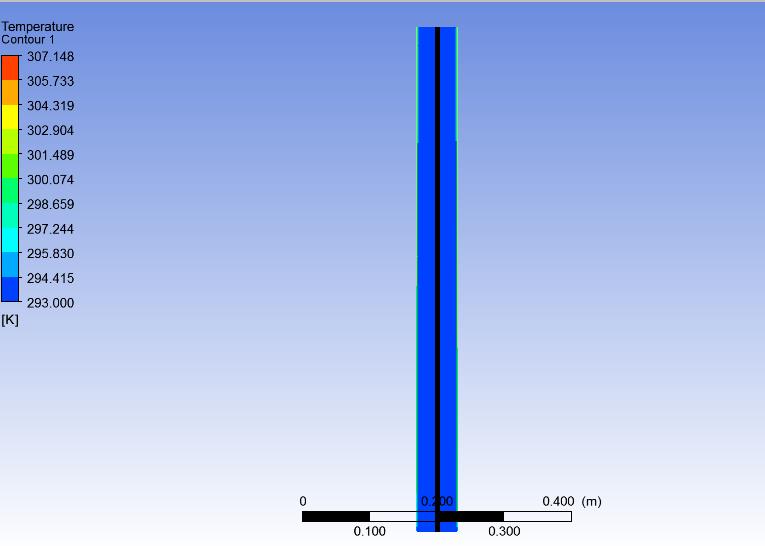
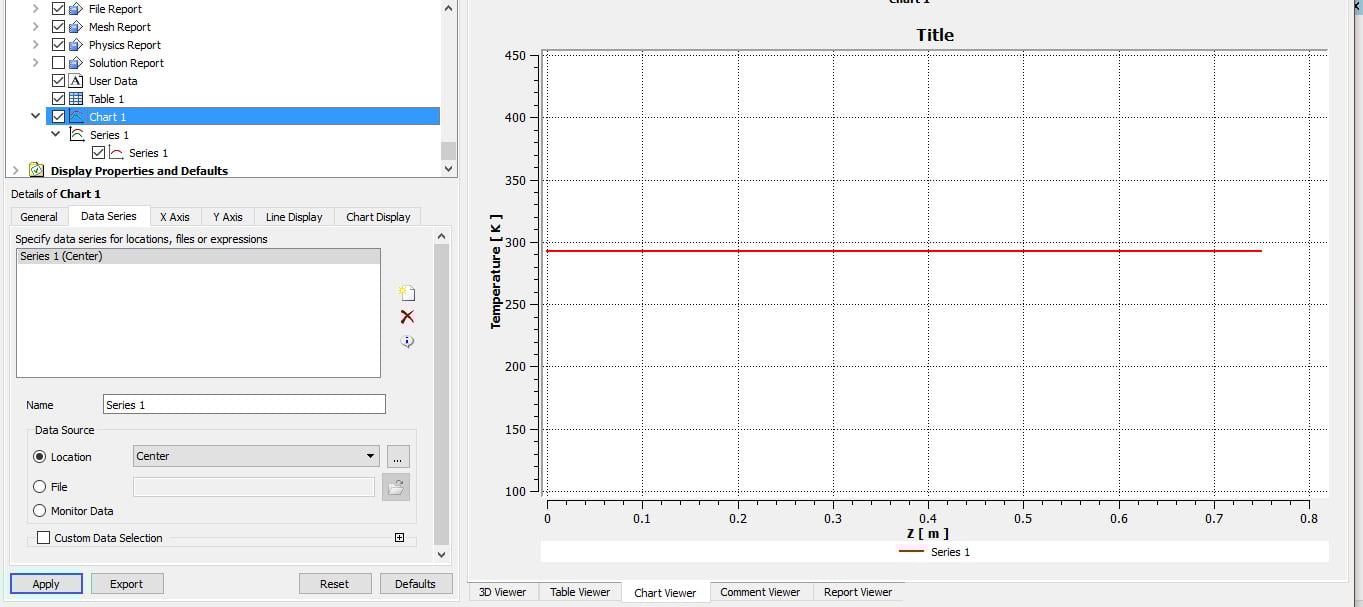
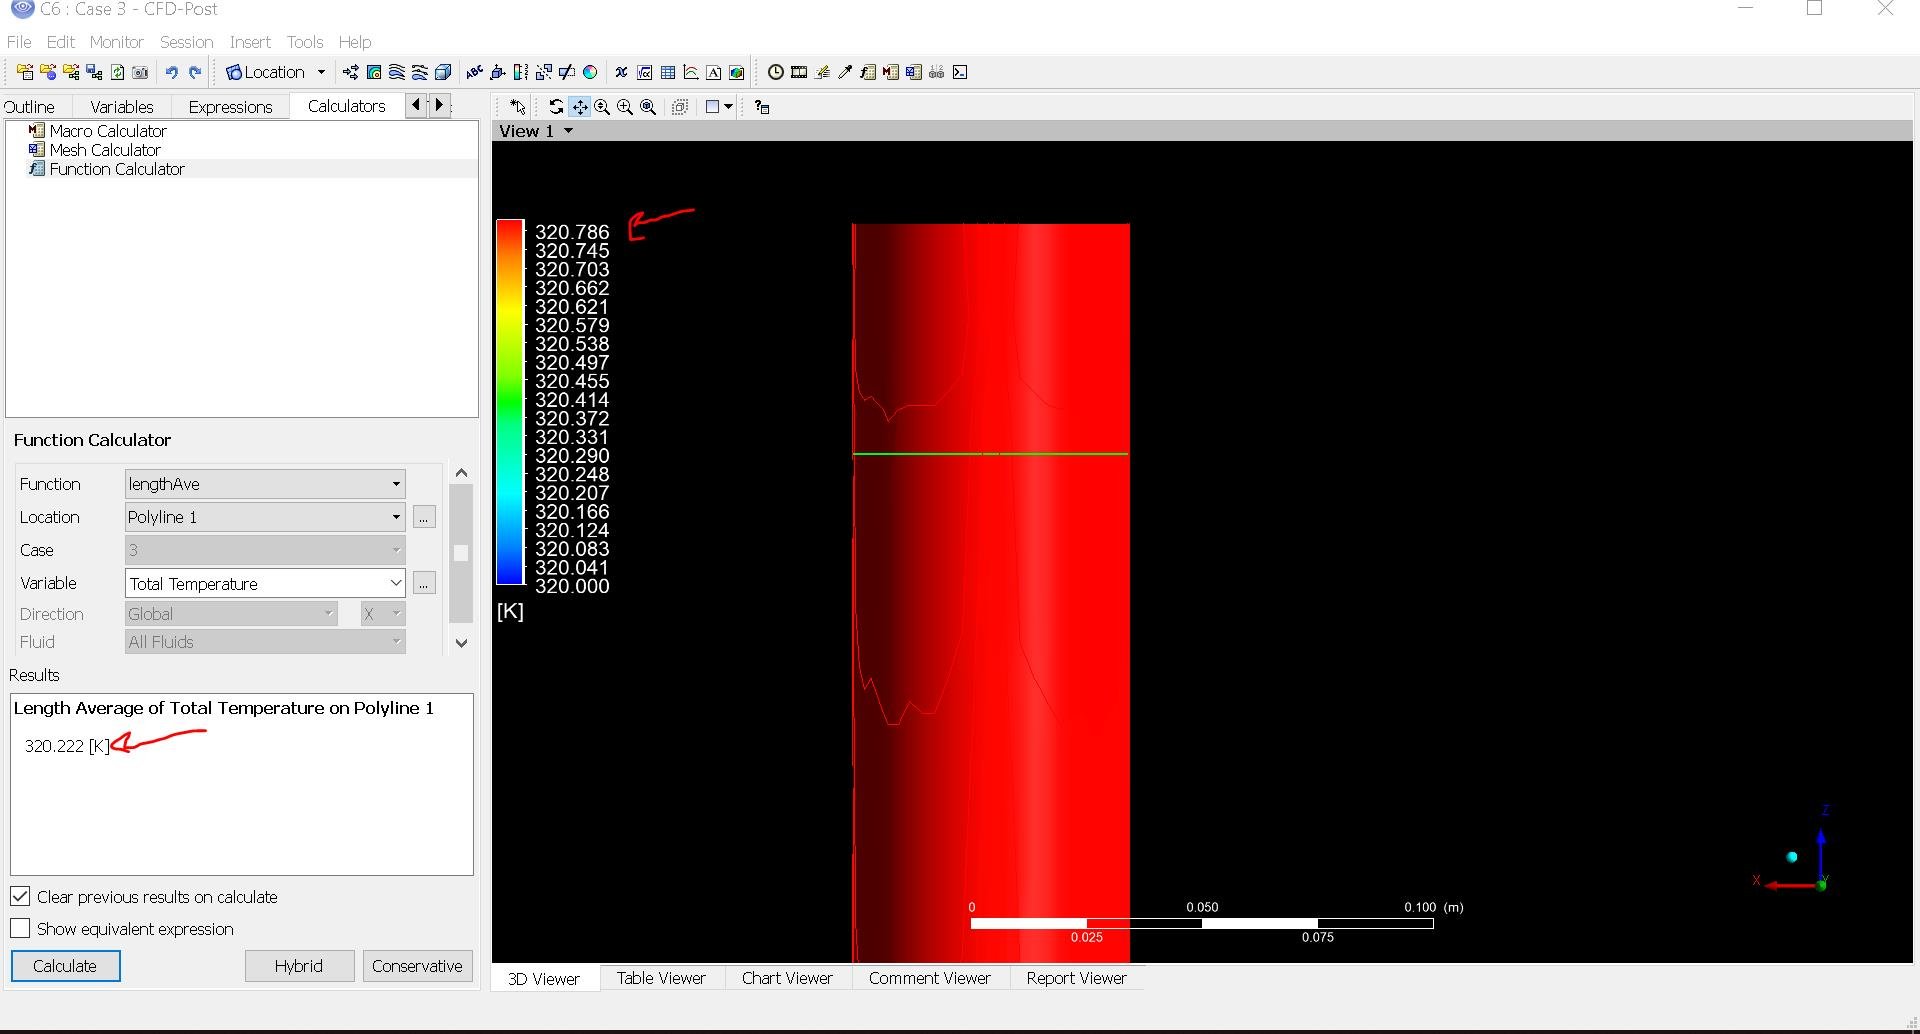
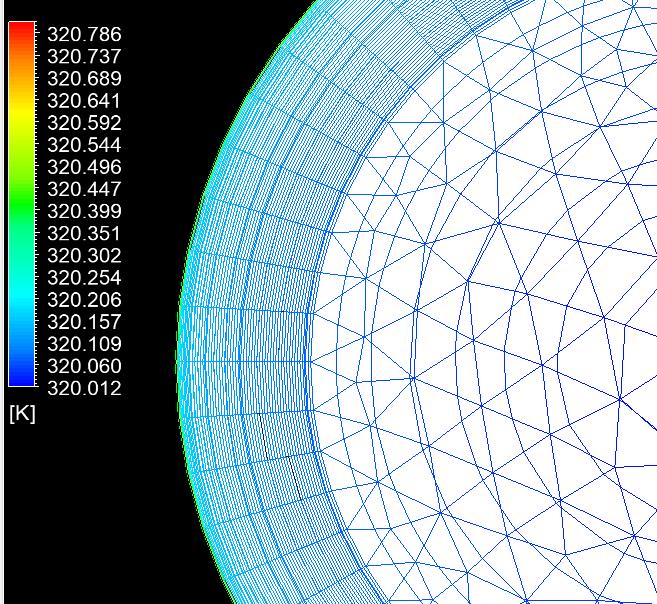
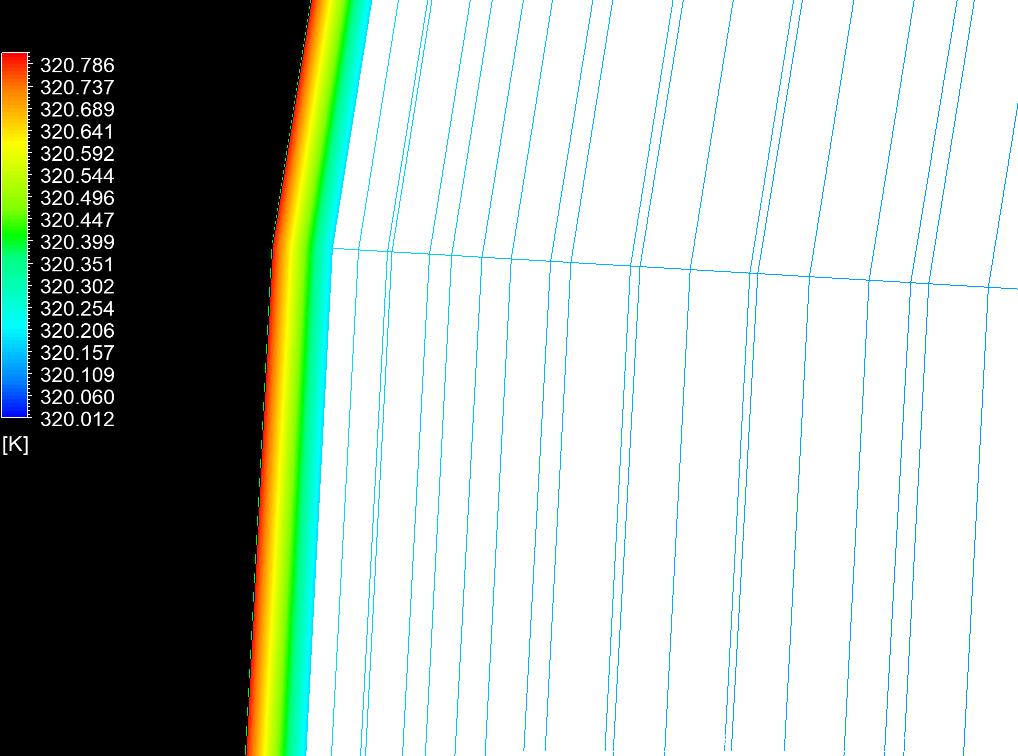
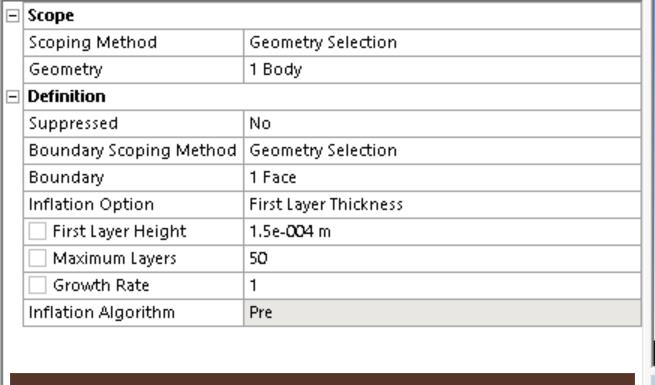
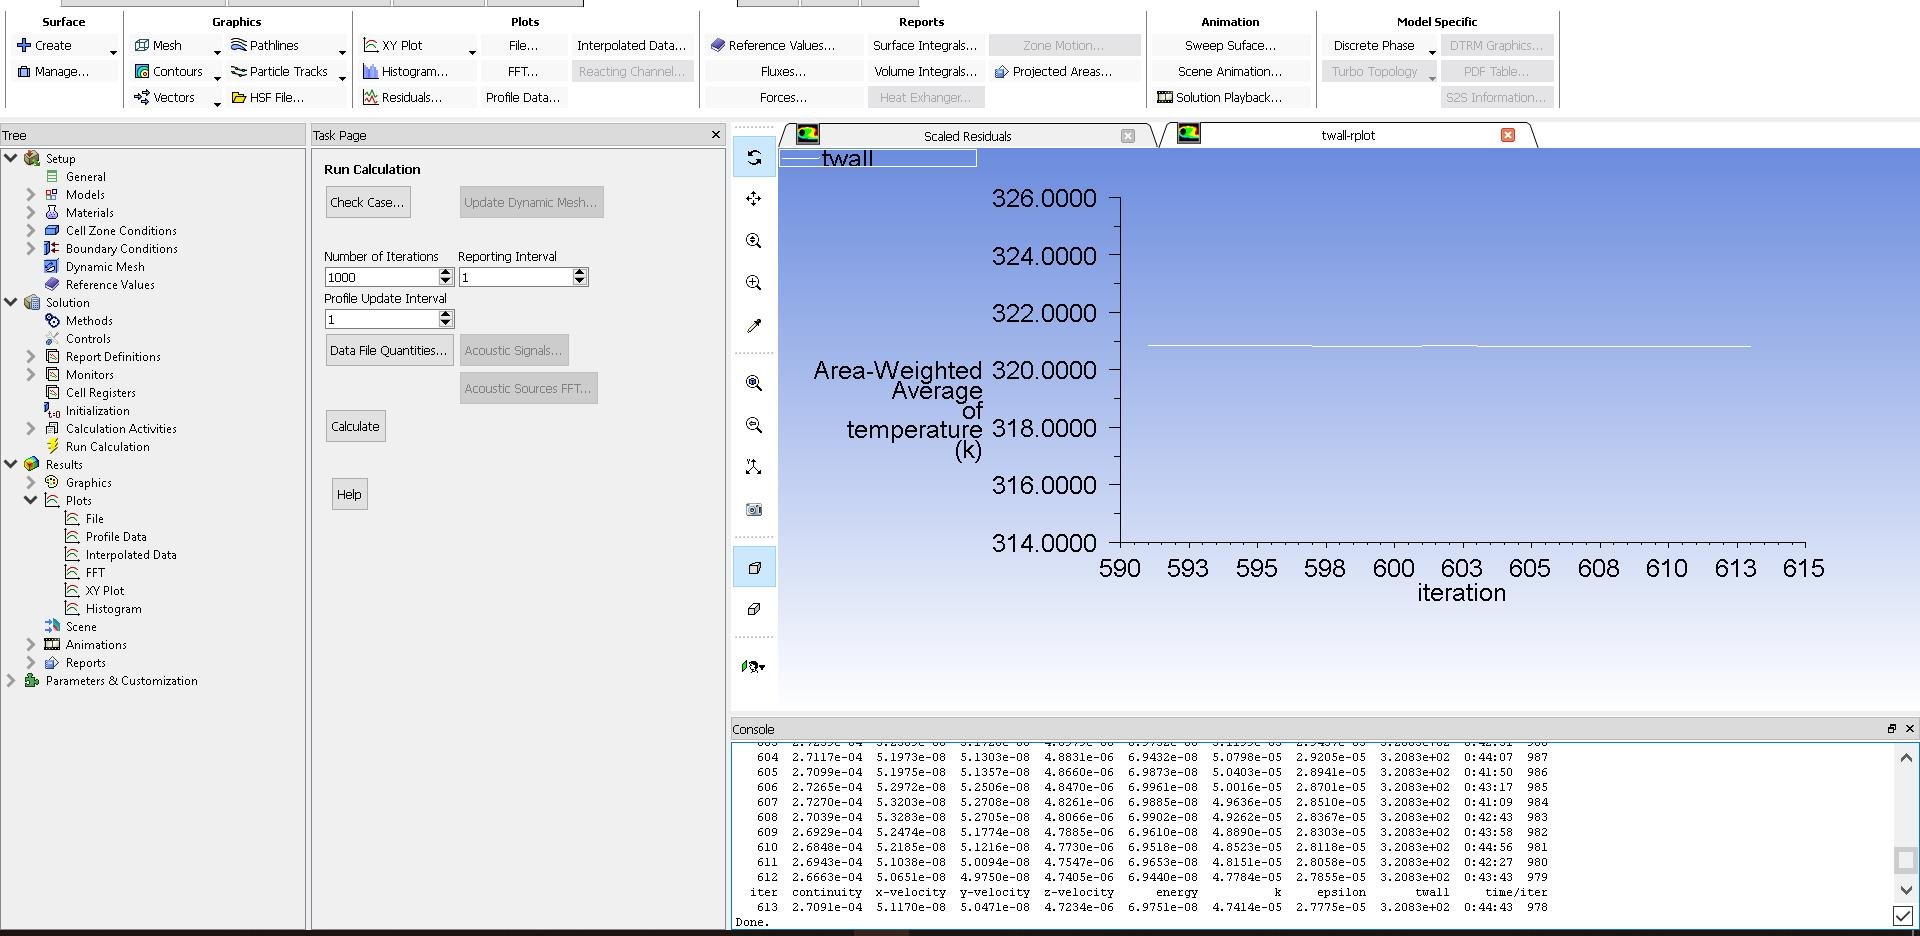
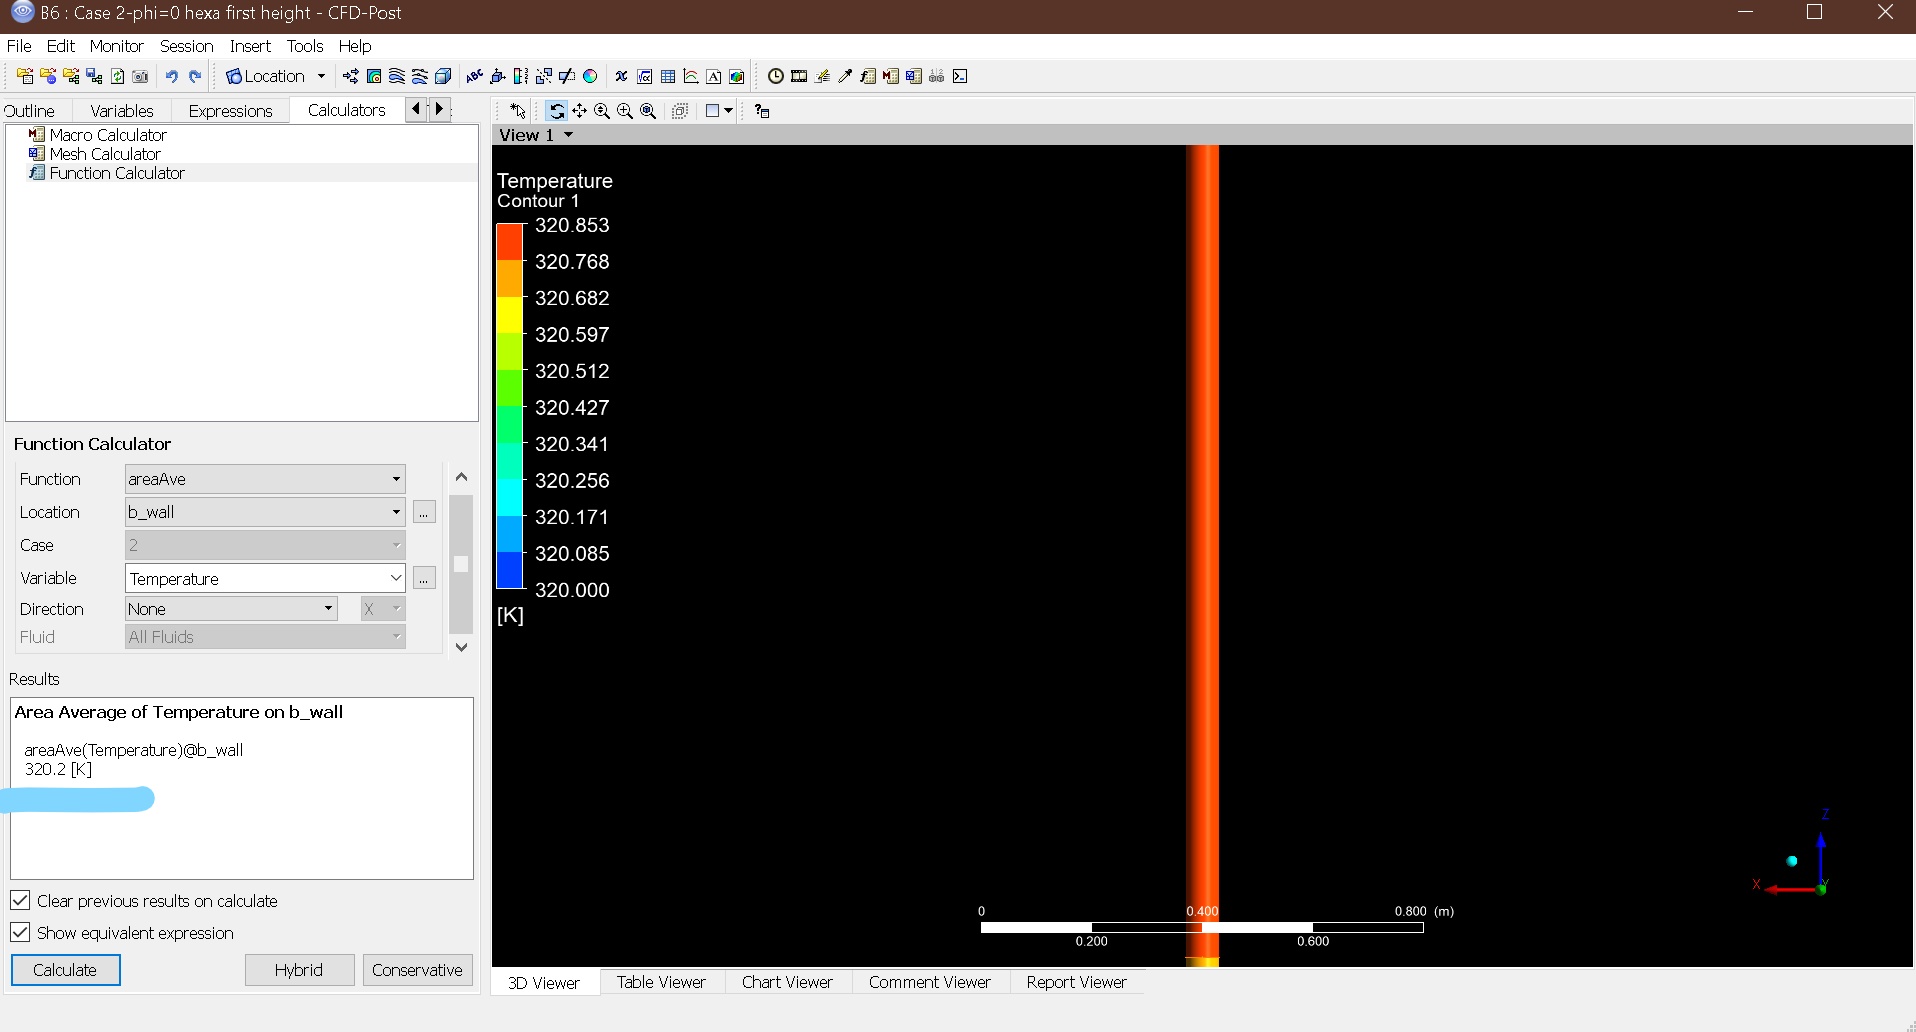
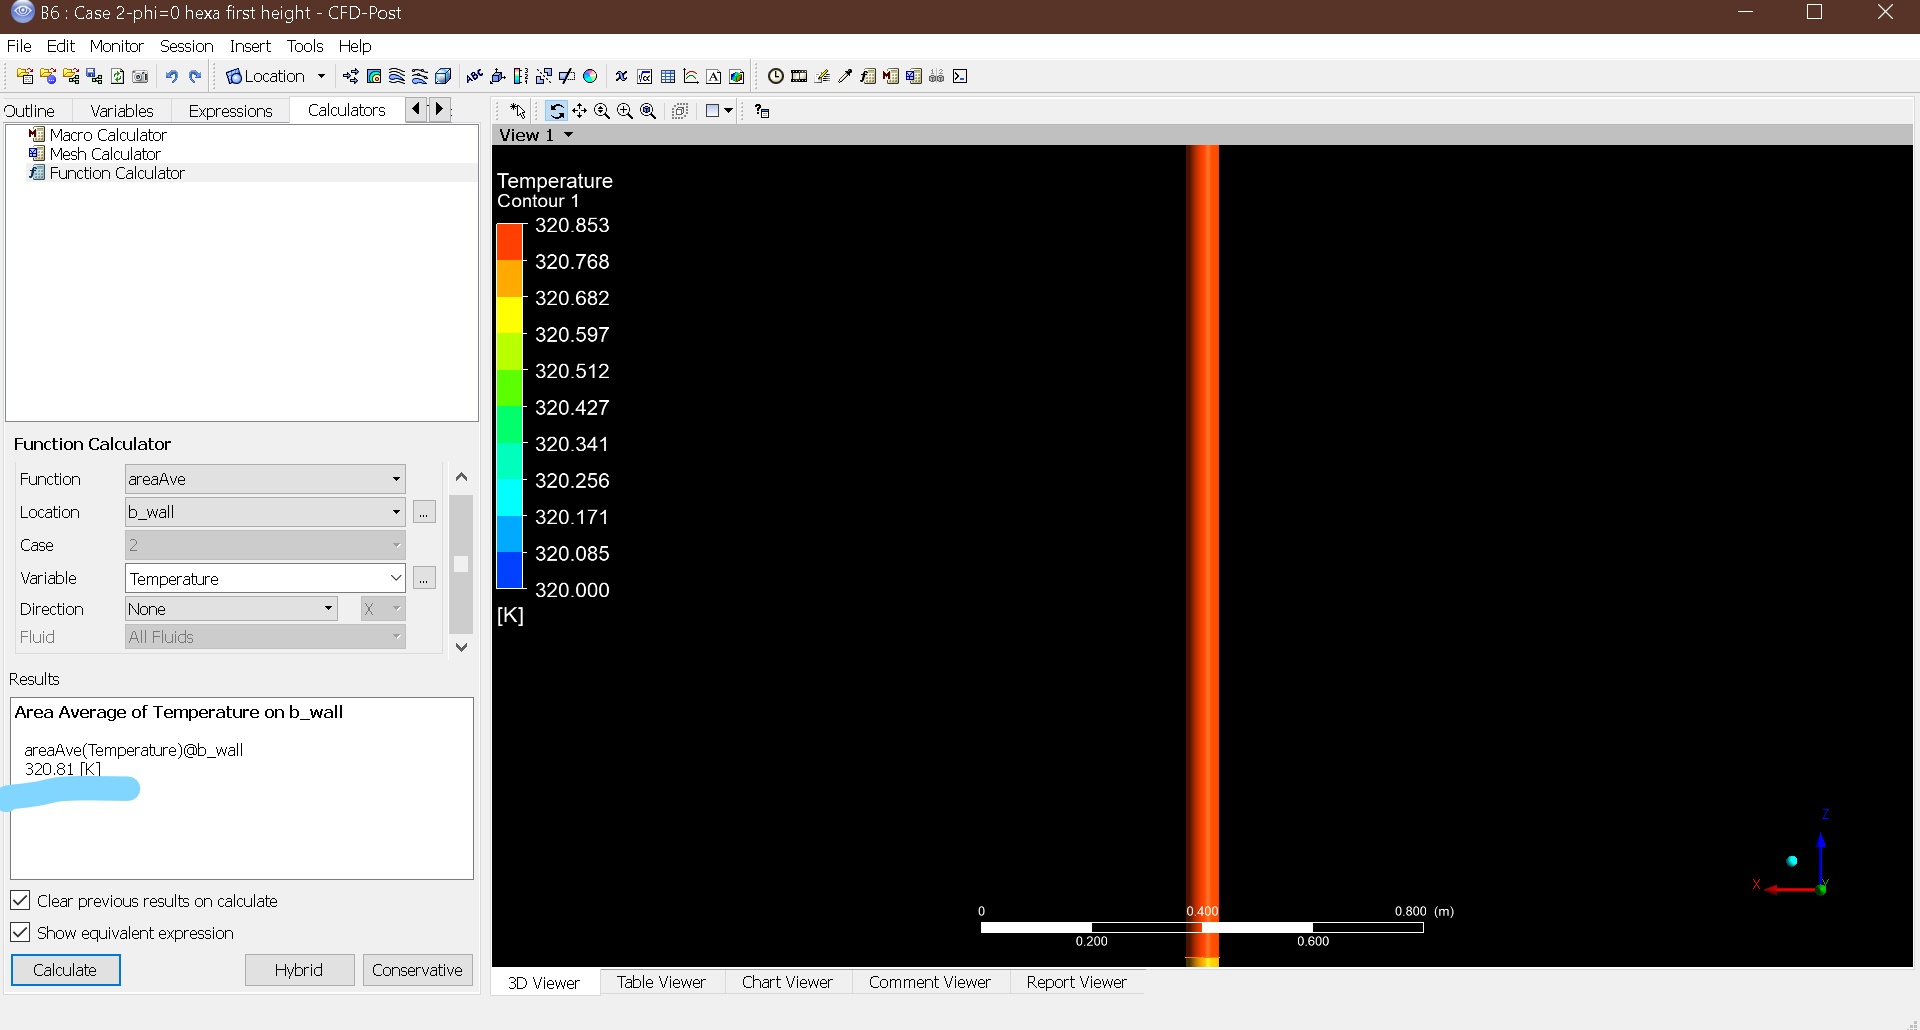
Difference results form the contour and the chart.’ is closed to new replies.
-
4728
-
1565
-
1386
-
1242
-
1021
© 2026 Copyright ANSYS, Inc. All rights reserved.


