Hello!
I am trying to simulate 3D flow over solar panels and determine what kind of loads do they face in a high speed wind storm type of situation.
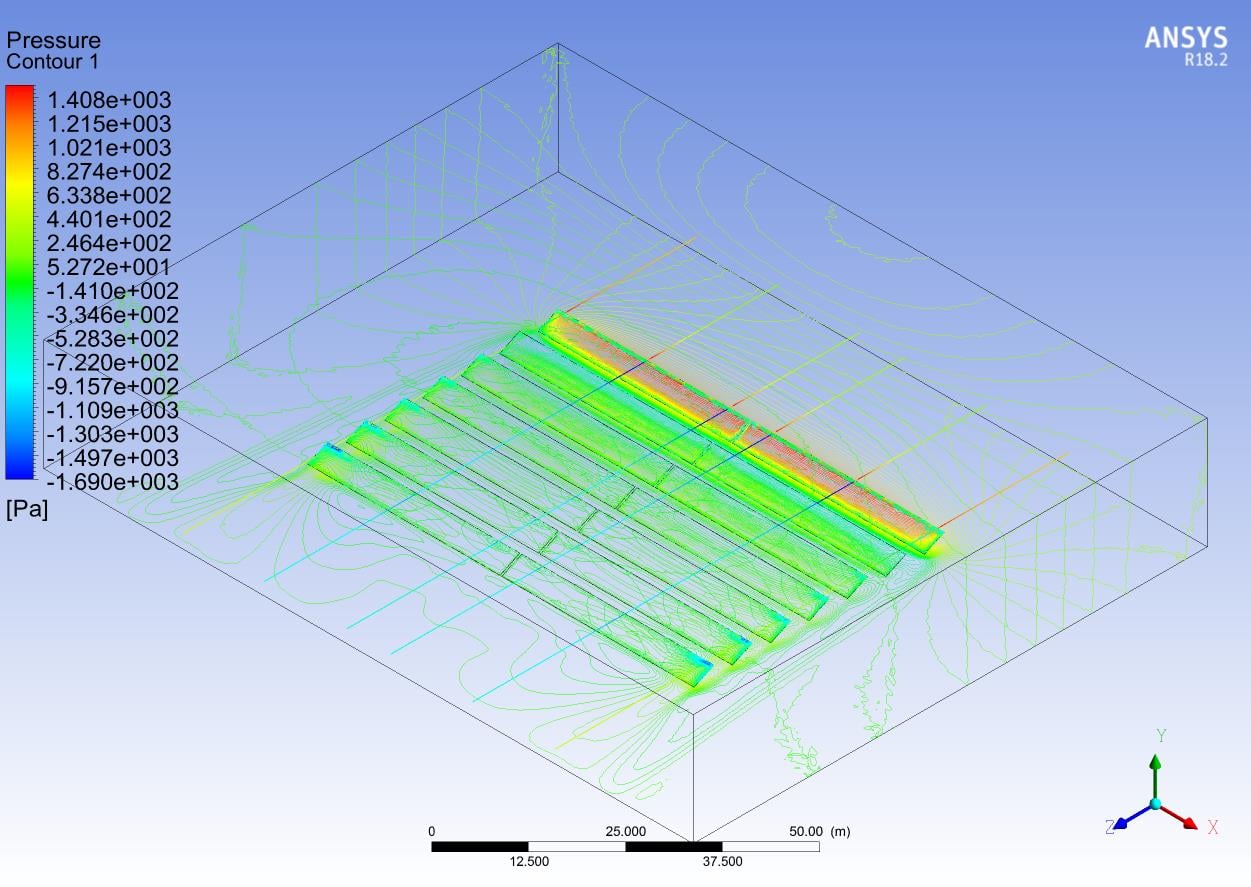
the wind is coming from behind them and the streamlines take the shape above. Then i constructed 3 lines near the top of the panels and attempted to find out the variable pressure from right to left.
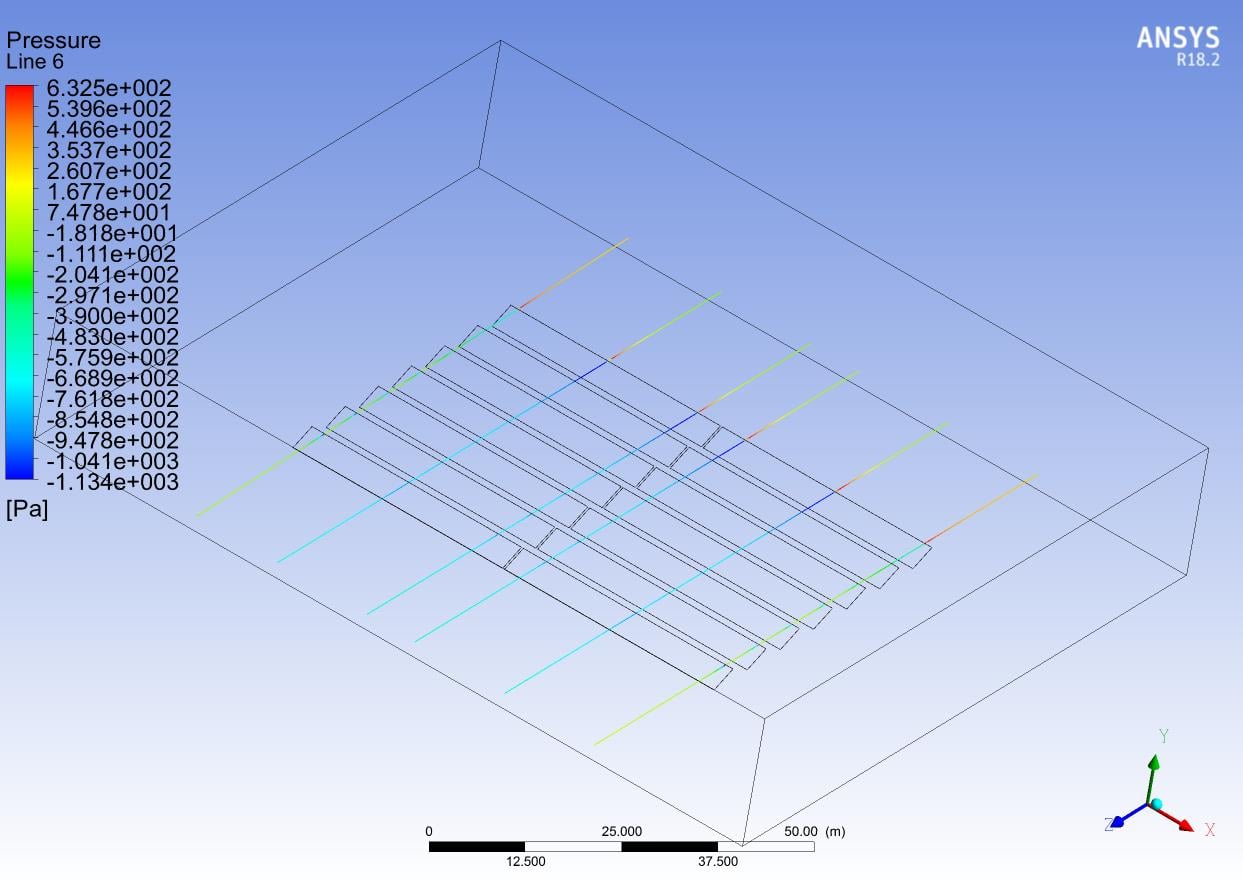
When i plotted these lines in a chart, the pressure just below the panels where the density of streamlines is less came out to be a negative value.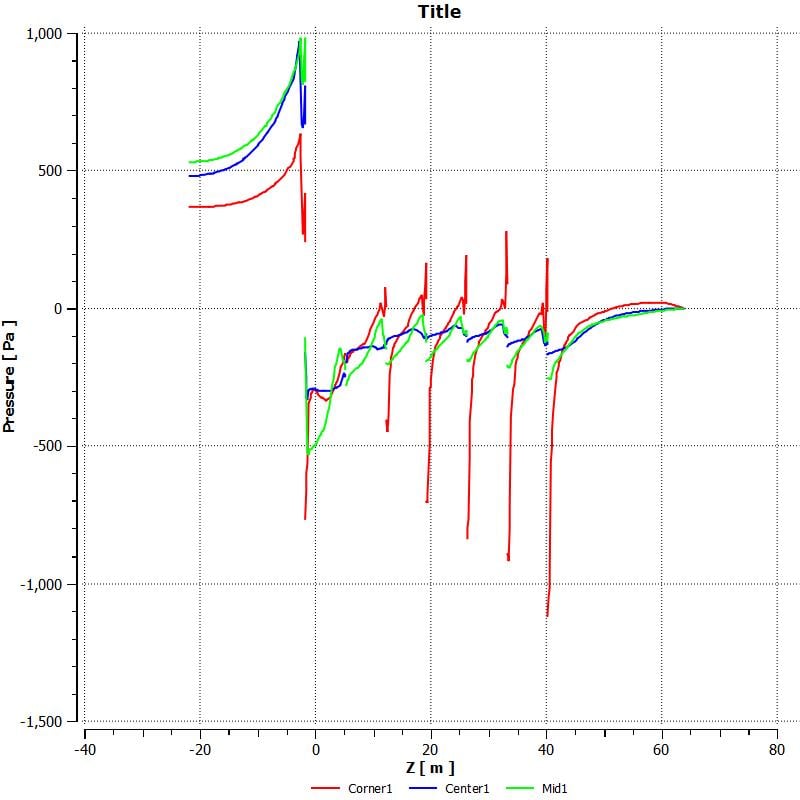
I thought they may come out to be low but i don't know why they come out to be negative. Is this maybe because the air above the panels is moving at a faster rate and therefore have lower pressure than the air between the panels and thus the air gets sucked upwards and leaves a negative pressure between the panels. Please share if there is any other rational explanation for the phenomenon. Thanks.




















 You are navigating away from the AIS Discovery experience