-
-
July 21, 2024 at 5:39 am
huyhoang.chu
SubscriberHello,
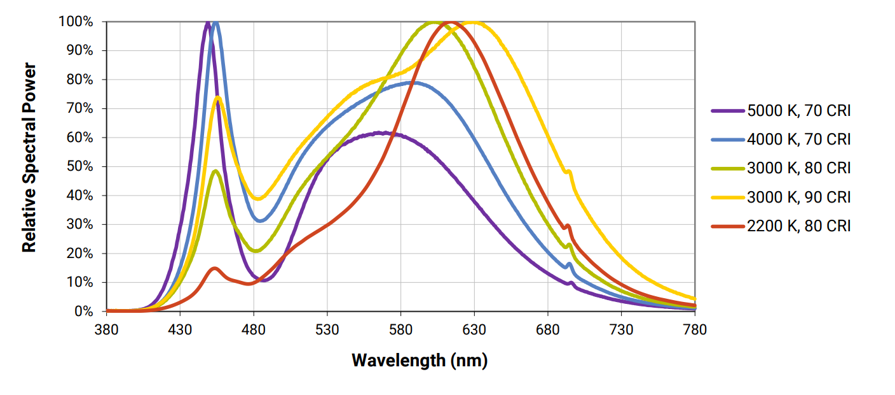
I am currently involved in a project requiring custom a light source following the spectrum as images. I tried to modify the plane wave tab in FDTD but could not change the profile.
It would be appreciated if anyone could point me out how to do it.I also have a second question: does numerical support partial coherence light source? I also need to work on a light source with a center wavelength of 0.5 um and 3 um coherence length.
Thank you for your support.
Figure 1. The light source profile I want to use in FDTD (5000K).
-
July 22, 2024 at 6:56 pm
Guilin Sun
Ansys EmployeeFor the 1st question, if your simulation is linear optics, eg, the material property does not change with optical intensity, it absolutely does not need to use special source spectrum. This is because the frequency-domain results are normalized with source spectrum: Understanding frequency domain CW normalization
In case you need absolute power after simulation, you can simply multiply the real source intensity/power to the normalized results. Examples are for solar and detector simulations.
FDTD directly solve Maxwell Equations. Therefore it is coherent. You may need to some post processing for the results required with "partial coherence" if you know the physics. For example, although FDTD uses coherent source, you can get incoherent results by average the intensity/power quantities with 2 or 3 polarized coherent results:
https://optics.ansys.com/hc/en-us/articles/1500006149562-Polarization-incoherence
https://optics.ansys.com/hc/en-us/articles/360034902293-Understanding-coherence-in-FDTD-simulations
-
August 2, 2024 at 6:51 am
huyhoang.chu
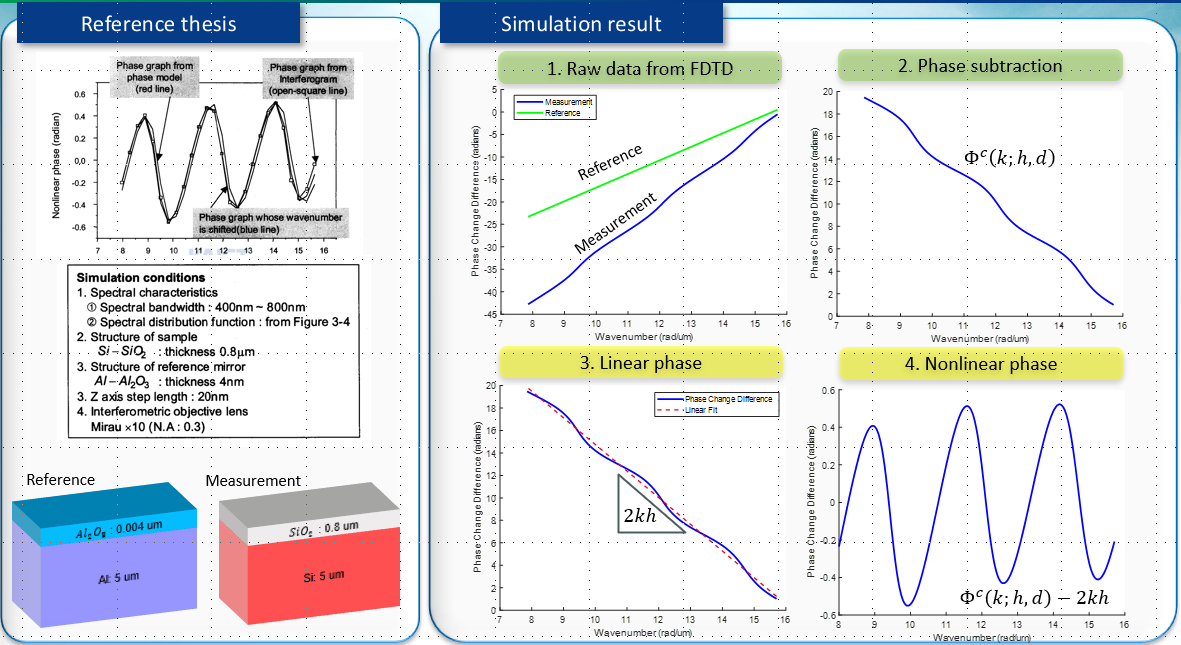
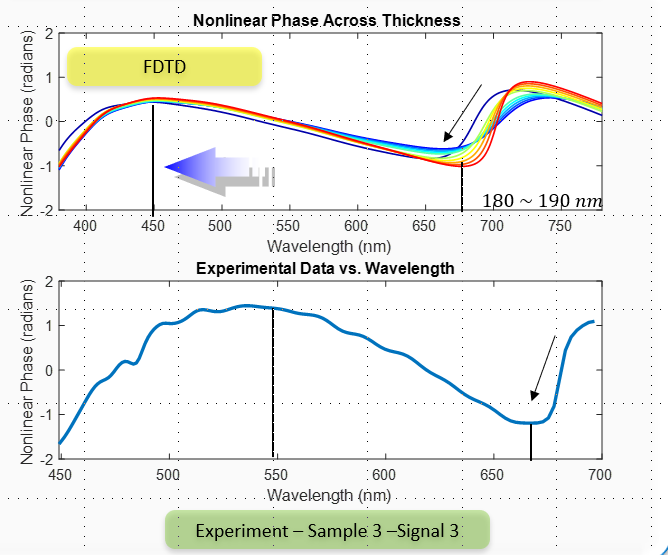
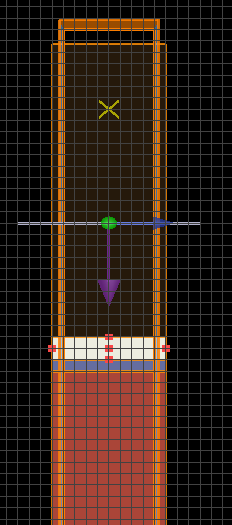
SubscriberDear Mr. Guilin SunThank you for your reply.What I want to simulate is the phase change upon reflection of multiple thin film stacks in FDTD. The phase change will be the combined phase, including a linear term and a nonlinear term. I am interested in the nonlinear term because I will compare this nonlinear phase change to the nonlinear phase extracted from the coherence scanning interferometer signal.I successfully extracted the phase change for a simple structure and showed the same result with the reference paper (Figure 1). However, when I tried to simulate more layers (Figure 2), the result from the FDTD simulation differed from the experiment (Figure 2). The structure I simulated in Figure 2 is illustrated in Figure 3, and the FDTD setup is in Figure 4. I am not sure whether the light source or the absence of the Cu surface makes the simulation result differ.Figure 1
Figure 2
Figure 3
Figure 4
-
-
August 2, 2024 at 6:03 pm
Guilin Sun
Ansys EmployeeThis is normal to compare the simulated results with experiment or publications:
Ansys Insight: Why my simulation result is different from published paper or experiment?
In your case, you can use stackrt: stackrt - Script command since it is thin-film device without other nano structures.
In FDTD the phase is very senstive to the mesh accuracy, and the source/monitor locations.you can place both the source and the monitor as close to the device as possible to reduce the numerical errors.
-
- The topic ‘Custom light source profile and partial coherence light source in Ansys FDTD’ is closed to new replies.


-
3427
-
1057
-
1051
-
896
-
892

© 2025 Copyright ANSYS, Inc. All rights reserved.


