
-
-
March 29, 2022 at 2:22 pm
Medri17
SubscriberHello everyone ,
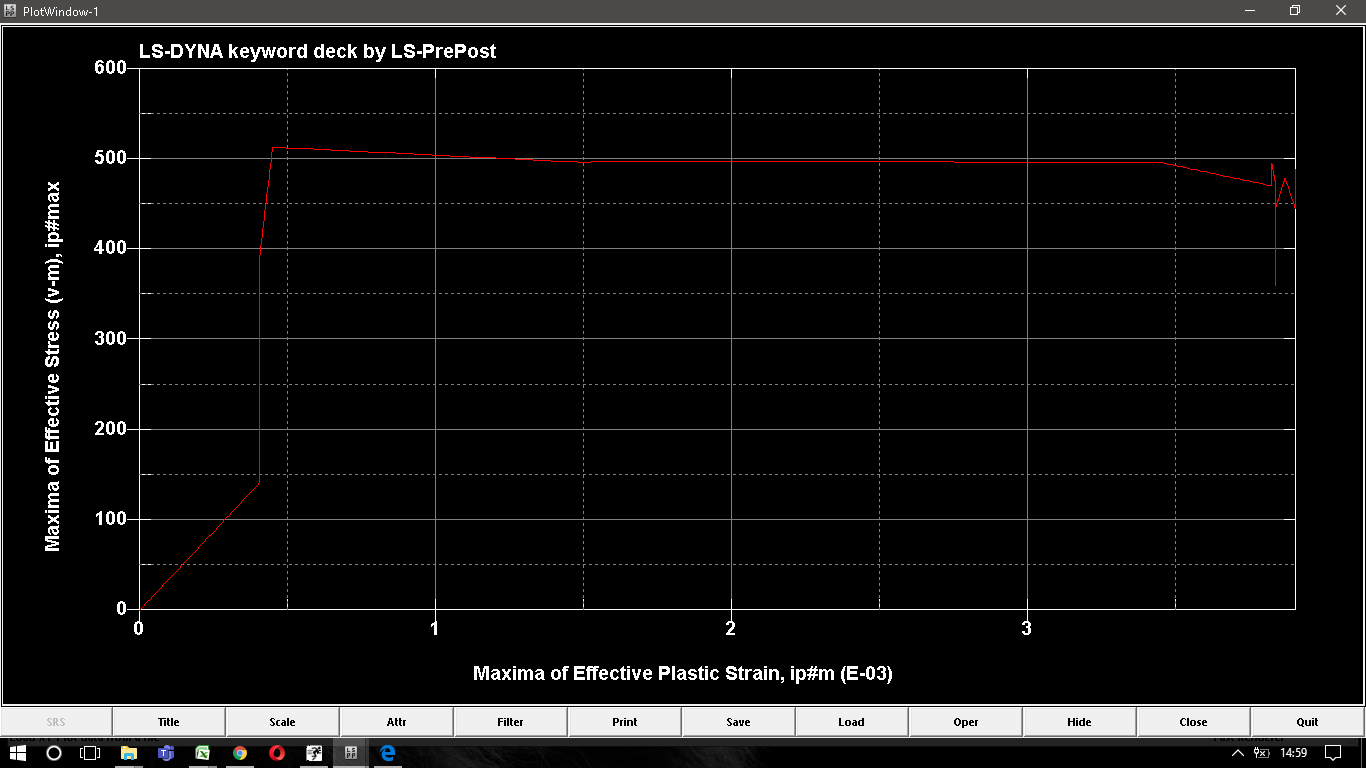
I ran a crash simulation , but i just cant interpretate the results , this doesnt seem logical to me , can anybody explain this graph ?
March 29, 2022 at 9:28 pmAndreas Koutras
Ansys Employeeit may help if you plot the effective stress -vs- effective plastic strain response at the same integration point. See *DATABASE_EXTENT_BINARY on how to output integration point data in d3plot.
March 30, 2022 at 1:57 amSubscriber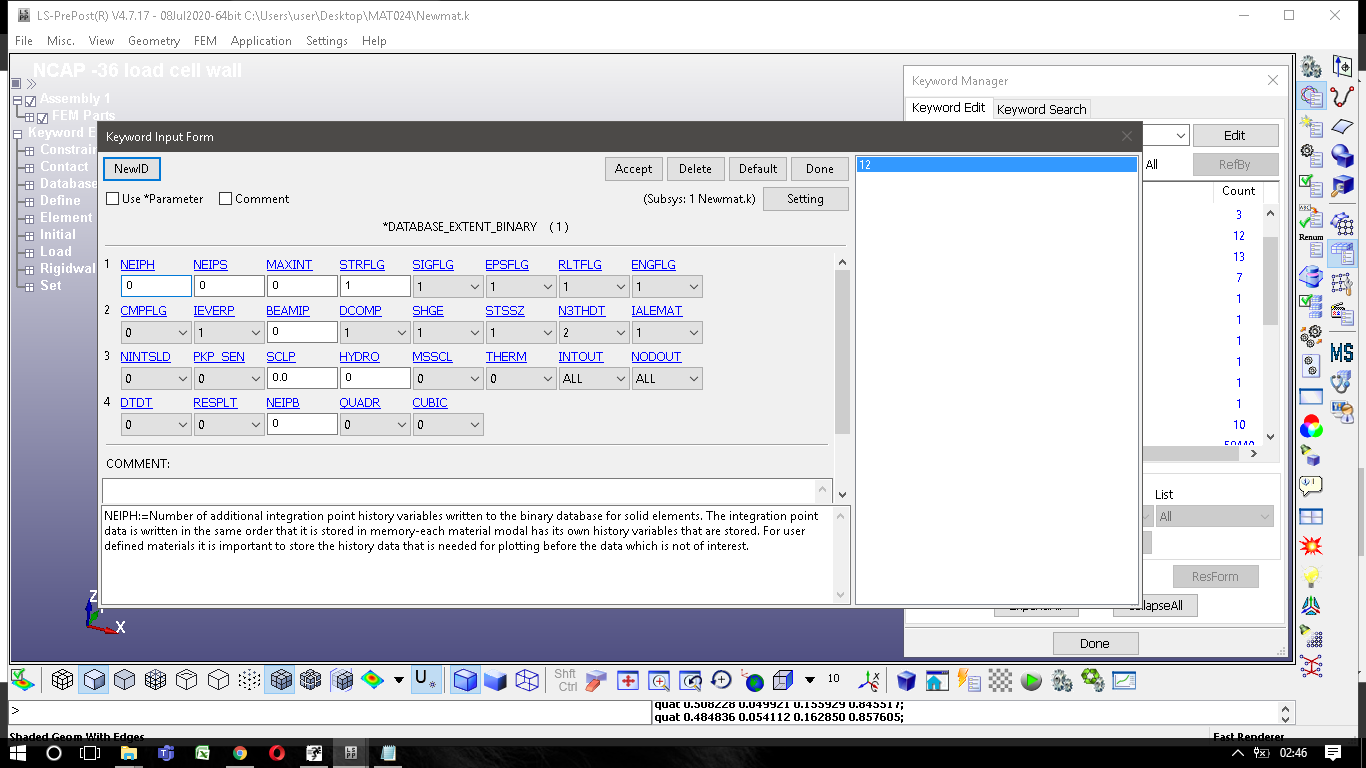 I dont quiet get what i need to input here , can u maybe guide me a little bit please?
And i dont get it , what would be the difference if i plot it in the same integration point and the image that i first post ?
Im sorry,im new to ls dyna
Thank you for your time
Viewing 2 reply threads- The topic ‘Crash simulation’ is closed to new replies.
Ansys Innovation Space Trending discussions
 Top Contributors
-
peteroznewman
 3432
3432 -
javat33489
 1057
1057 -
scabo
 1051
1051 -
Shyam Prasad V Atri
 896
896 -
Dennis Chen
892
Top Rated Tags
© 2025 Copyright ANSYS, Inc. All rights reserved.
Ansys does not support the usage of unauthorized Ansys software. Please visit www.ansys.com to obtain an official distribution.
-


The Ansys Learning Forum is a public forum. You are prohibited from providing (i) information that is confidential to You, your employer, or any third party, (ii) Personal Data or individually identifiable health information, (iii) any information that is U.S. Government Classified, Controlled Unclassified Information, International Traffic in Arms Regulators (ITAR) or Export Administration Regulators (EAR) controlled or otherwise have been determined by the United States Government or by a foreign government to require protection against unauthorized disclosure for reasons of national security, or (iv) topics or information restricted by the People's Republic of China data protection and privacy laws.


