
-
-
August 5, 2021 at 9:20 am
cwk_ansys
SubscriberHello friends,
I am doing an analysis of drop test of an object by using Ansys Workbench,
Basically I need to measure the acceleration at a point of an object when it impact at the ground.
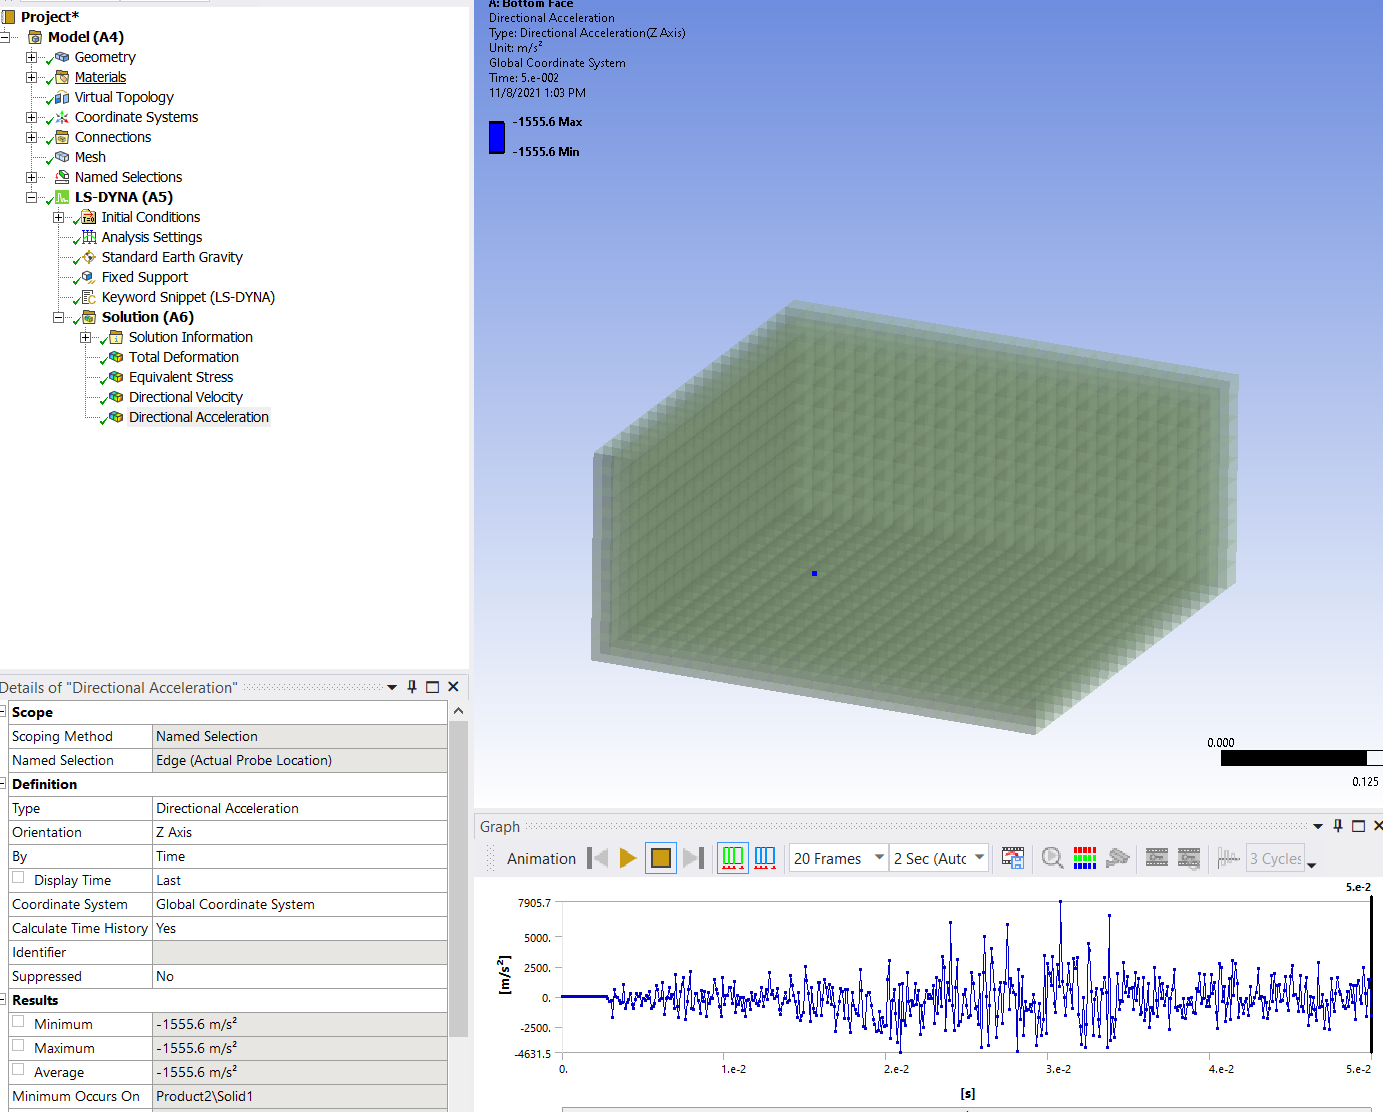
However, I noticed that the directional acceleration curve is very noisy, and the peak of the acceleration curve is unbelievably high, it reach 10608m/s^2 as shown in the figure below.
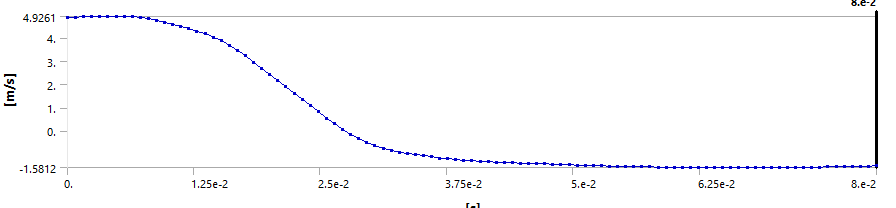
Whereas the velocity curve is very smooth.
Velocity graph:
August 5, 2021 at 11:22 ampeteroznewman
SubscriberRaw data from Explicit Dynamics solutions are known to be full of noise and smooth results can be obtained by low pass filtering, but only by filtering every cycle in the simulation. You have to do this to avoid aliasing the signal. The data you are showing in the graphs might be one in 100,000 cycles. Look at the total number of cycles and divide by the number of points in the plot. You would need to very carefully setup the model to write out data from the one node of interest on every cycle because if you write out results for every node in the model on every cycle, you will run out of disk space. Read the following discussion and follow the links in that discussion to the paper that explains this in detail.
/forum/discussion/22960/impact-acceleration-too-high
Regards Peter
August 5, 2021 at 12:30 pmSubscriberThanks for your reply.
I am using LS-Dyna as my analysis system, it don't have the settings of "result cycle" under output control.
Is LS-Dyna already write the data on every cycle by default?
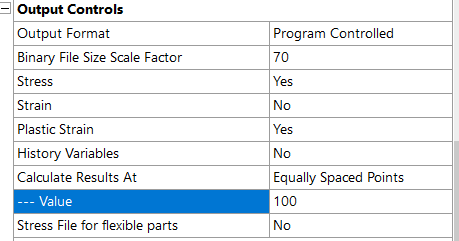
For your information, my analysis is set as:
End time = 0.08 second
number of output points = 100

August 5, 2021 at 2:51 pmSubscriber100 points is definitely not every cycle. What are the other choices on the Calculate Results At row?
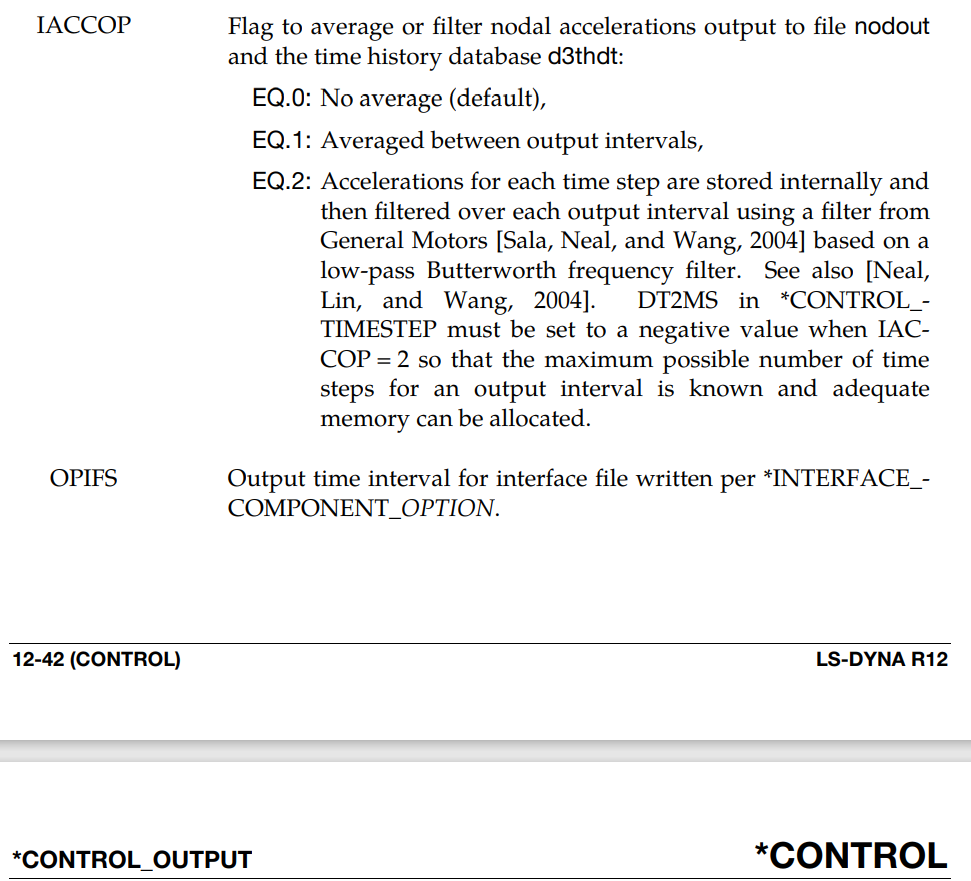
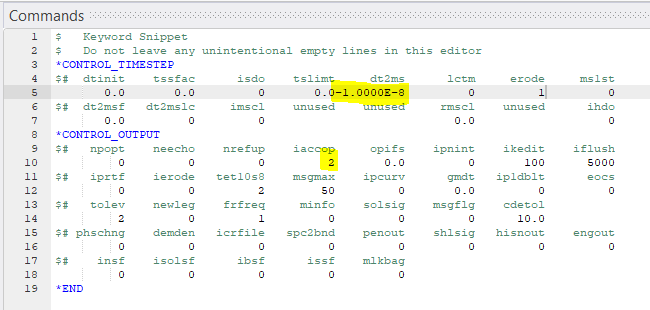
Have you read the LS-Dyna Manual? I opened the R12 Vol. 1 and found this gem under the *CONTROL keyword.
I suggest you use the IACCOP flag and set that equal to 2.
 Regards
Peter
Regards
Peter
August 9, 2021 at 10:20 amSubscriberThanks for your reply,
The discussion you shared is very informative.
In order to prevent alias, the sampling rate must be set to very high.
Therefore, I have increased my output point to 5000.
However, there is still some discrepancy from the data I got from these 2 methods:
1) differentiate the velocity/time data, apply low pass filter
 2) directly apply low pass filter to the directional acceleration
 Acceleration got from Method 1 is closer to experimental data.
Could you explain the discrepancy of the data between these 2 method? which are the correct method of obtaining acceleration?
August 9, 2021 at 11:10 amSubscriberYou don't understand aliasing and how to avoid it. You can't simply increase the output to 5000 points in the 0.05 s time. That is a sampling period of 1e-5 s. What is the Explicit Dynamics time step? It may be 1e-8 s, or 1000 times smaller. The point of the paper is that you have to have every single time step from the simulation. You can't take just one in every 1000 time steps and filter that decimated data. That is how you create an aliased signal. You have to apply the filter on every single time step from the simulation. Doing this requires limiting the output to a very small number of nodes to avoid filling your entire hard drive.
LS-Dyna has recognized this issue and provided an internal low pass filter that is applied to every single time increment in the solution. Did you use the *CONTROL keyword and set the IACCOP flag equal to 2 before you you requested the acceleration output? If you don't do this, then you are better off using the velocity data.
August 10, 2021 at 3:33 amSubscriberOnce again, thanks for your great explanation!
I always though that Explicit Dynamics time step=sampling time step that I set.
It turns out that there is a Explicit Dynamics time step, the simulation only record the data of sampling time step to our hard drive.
However, I can not find and set the ls-dyna time step in Ansys mechanical.
 Even if I could, I don't have the storage size to store all the raw data.
5000 points already occupied 80GB of hard drive, If I were to record all the data of every time increment of the simulation, it would take more than 10TB.
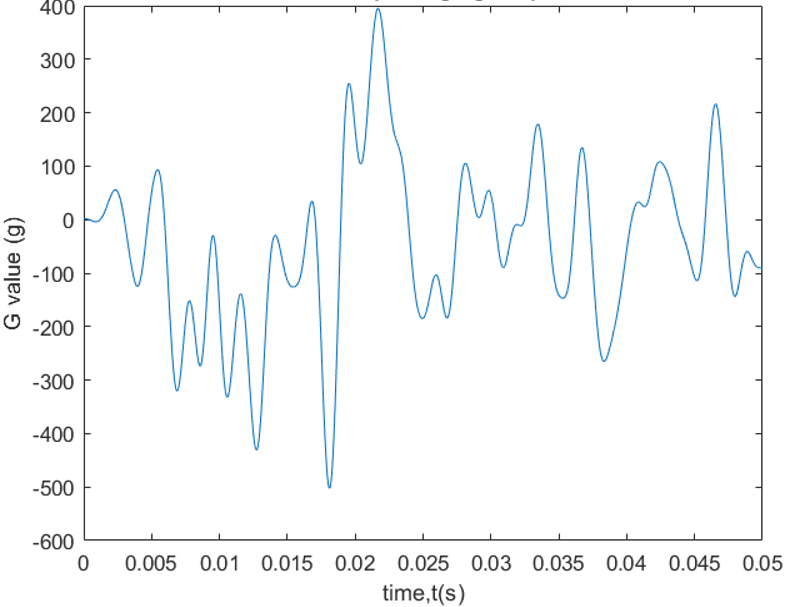
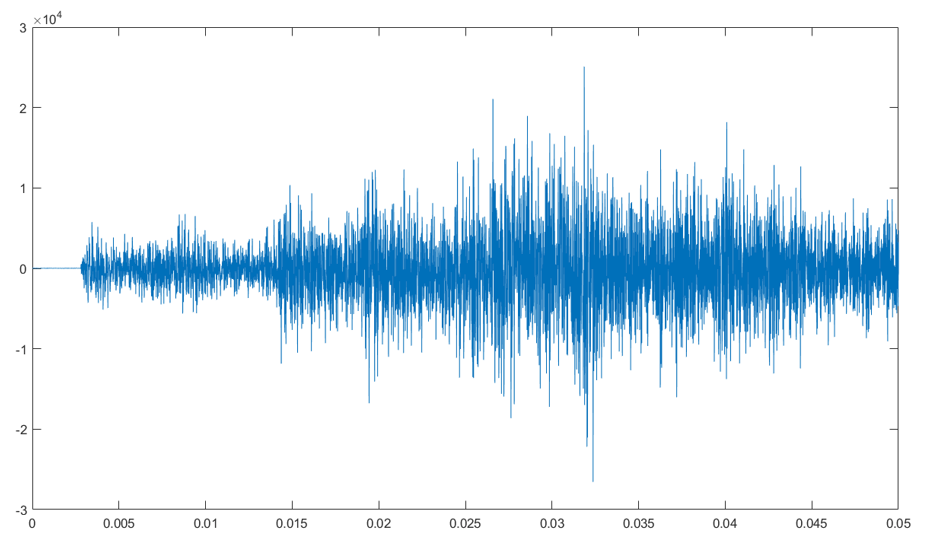
This is the acceleration graph that plotted with IACCOP flag equal to 2, it is still very noisy
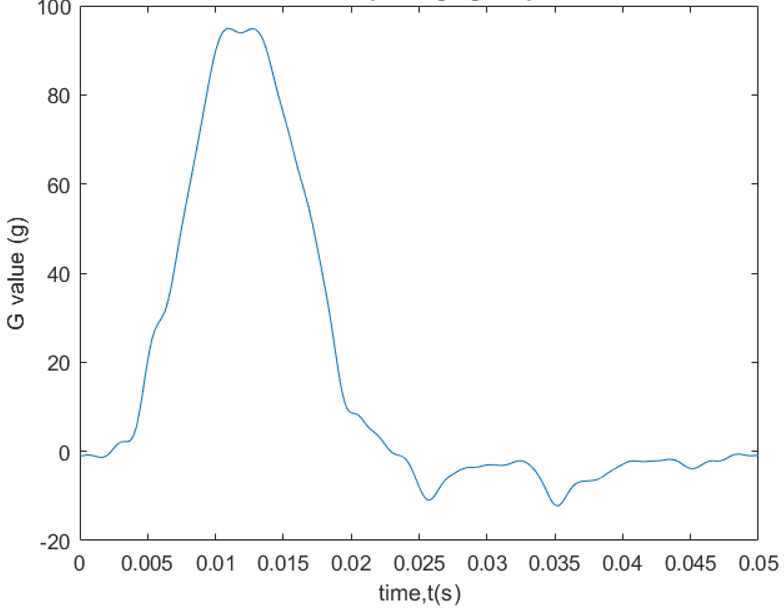
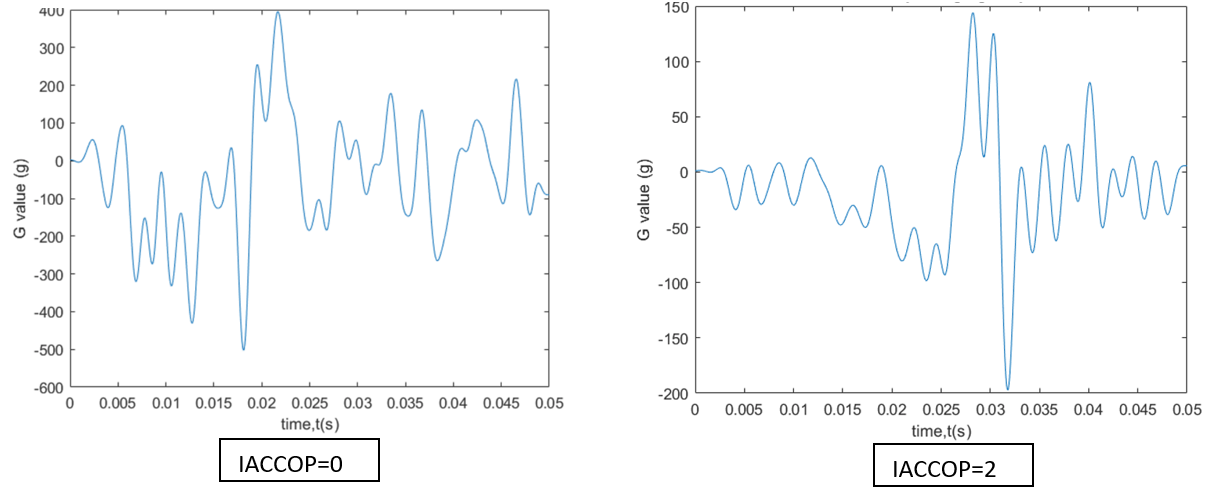
 These are the graph that applied low pass filter, the peak value of IACCOP=2 is lower than IACCOP=0.
Even with IACCOP=2 and low pass filter applied, the graph is not smooth and fluctuating.
 Finally, can you help to confirm the following statements?
1) The acceleration graph after applying low pass filter is very noisy and incorrect because data has been aliased due to the time step that I set.
Every single increment of time step from the simulation need to be taken and applied to low pass filter in order to get the correct acceleration curve.
2) The velocity graph is smooth because it is integrated from acceleration in every Explicit Dynamic time step, and then decimated to my time step that I set.
August 10, 2021 at 12:01 pmSubscriberPoint 1 is correct. You need to filter every time step. Read the snapshot from the LS-Dyna manual about IACCOP again and note that it says when you set IACCOP = 2, you also have to set DT2MS in *CONTROL_TIMESTEP to a negative value.
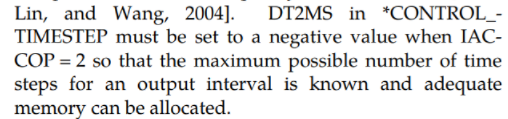 Did you set DT2MS to a negative value when you wrote out data with IACCOP = 2 ?
Is that graph the output of a single node, or the average value of many nodes? Try filtering a single node.
Yes, I understand when you write out this much data, you quickly run out of disk space. Instead of 5000 points, use 5 points and it will reduce the storage from 10 TB to 10 GB. That is why not having to write data on every time step and instead using IACCOP=2 allows LS-Dyna to do the low pass filtering internally is such a useful feature, because you can now request output at a "normal" frequency.
Point 2 is correct.
Disclaimer: I don't use LS-Dyna, I am just applying what I know about data acquisition.
August 11, 2021 at 5:06 amSubscriberPreviously I already set the dt2ms to negative value. The graph is the output of a single node.
The graph still looks very noisy even though IACCOP=2 and dt2ms=-1E-8
 Is there any way to set the cut-off frequency of internal low pass filter?
August 11, 2021 at 12:32 pmSubscriberAs I said before, I don't use LS-Dyna, so I can only offer general guidance. Others are welcome to comment.
I don't know what dt2ms=-1E-8 means. Does it mean you are overriding the time increment that is automatically calculated? What was the automatically calculated value? The automatically calculated time step guarantees stability in the numerical algorithm and is computed from the characteristic length of the element, the density and the Young's modulus. If the automatically calculated value was 1E-9 and you are using a larger value, then you would be using a time step that does not meet the stability requirements for the algorithm. Perhaps that is causing the fluctuations.
I don't know if it is possible to control the internal low pass filter characteristics. Maybe the internal filtering is not as good as what can be done outside the solver with all the data.
November 7, 2023 at 1:29 pmangelo.baj
SubscriberHi,
Is it possible to apply this low pass filter in "explicit dynamics" module of Ansys? If Yes, how?
Viewing 10 reply threads- The topic ‘Correct method to obtain acceleration curve from a drop test (Ansys Workbench)’ is closed to new replies.
Innovation Space Trending discussions
 Top Contributors
-
peteroznewman
 5799
5799 -
scabo
 1906
1906 -
Dennis Chen
 1419
1419 -
javat33489
 1305
1305 -
Shyam Prasad V Atri
1021
Top Rated Tags
© 2026 Copyright ANSYS, Inc. All rights reserved.
Ansys does not support the usage of unauthorized Ansys software. Please visit www.ansys.com to obtain an official distribution.
-


The Ansys Learning Forum is a public forum. You are prohibited from providing (i) information that is confidential to You, your employer, or any third party, (ii) Personal Data or individually identifiable health information, (iii) any information that is U.S. Government Classified, Controlled Unclassified Information, International Traffic in Arms Regulators (ITAR) or Export Administration Regulators (EAR) controlled or otherwise have been determined by the United States Government or by a foreign government to require protection against unauthorized disclosure for reasons of national security, or (iv) topics or information restricted by the People's Republic of China data protection and privacy laws.
