-
-
December 13, 2023 at 3:14 pm
ceshi xiazai
SubscriberDear all,
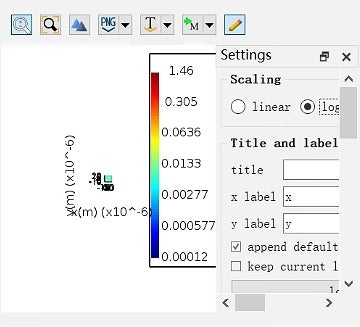
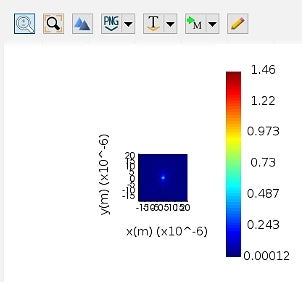
I am so confused about the log scaling of color bar in FDTD. The upper pic is with linear scaling while the lower pic is with log scaling. It seems it's not loge,log2 &log10 cuz the intensity is less than 1 and will be transformed to negative numbers if so. Could you please tell me how the math goes in this transformation? I wanna process this graph in MATLAB but don't know how.
-
December 14, 2023 at 8:56 am
Afroditi Petropoulou
Ansys EmployeeDear Ceshi,
The logarithmic scale works the same way as in excel and other tools. When a logarithmic scale is used in a chart, the data are displayed in such a way that the values of the colorbar (or of the axis that is in log sacle) are not evenly spaced. Instead, the values are spaced according to the logarithm of the value. Hence, it does not plot the logarithm of the value but changes the spacing instead. The values that are displayed are the same as you can see from the max and min values of the colorbar.
If you want to get the logarithm of these values and then export them in MATLAB, you can use script.
Best Regards,
Afroditi
-
December 15, 2023 at 10:13 am
ceshi xiazai
SubscriberDear Afroditi,
Thanks for your kind reply! Do you mean that the values of the color bar are not processed with logrithm transformation and just spaced according to the logarithm of the value, right?
Best Regards,
Ceshi
-
December 15, 2023 at 12:34 pm
Afroditi Petropoulou
Ansys EmployeeDear Ceshi,
Correct. The values are the original ones, while the spacing is according to the logarithm of the values.
Best Regards,
Afroditi
-
- The topic ‘Color bar issue’ is closed to new replies.


-
4102
-
1487
-
1318
-
1156
-
1021

© 2025 Copyright ANSYS, Inc. All rights reserved.


