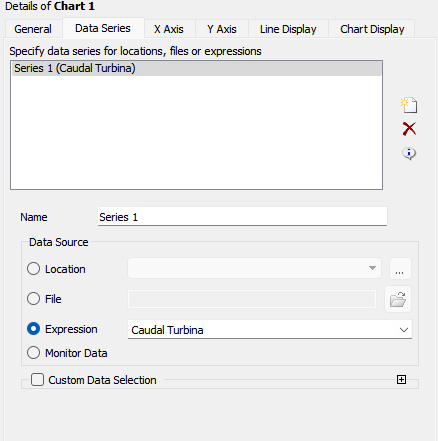
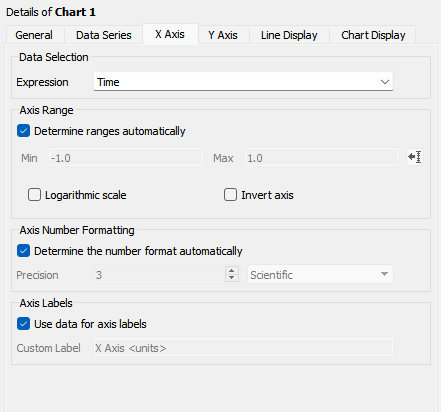
Hello everyone. I'm trying to generate a XY- Transient Chart using an expression in the Data Series Tab, setting the X-axis as Time and the Y-axis as the Expression.
The expression is a scalar value, which is the Mean Flow Rate passing through a defined area in a 3D simulation.
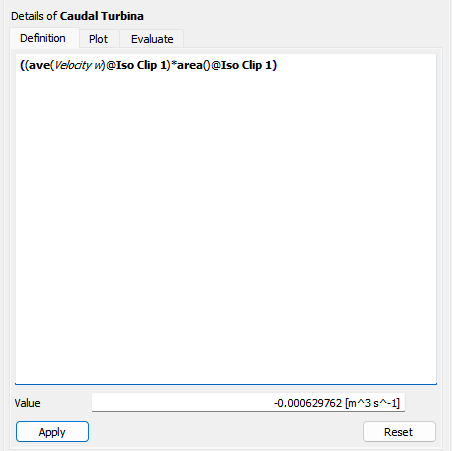
For each time-step the resulting value changes. That’s what I’m trying to plot.
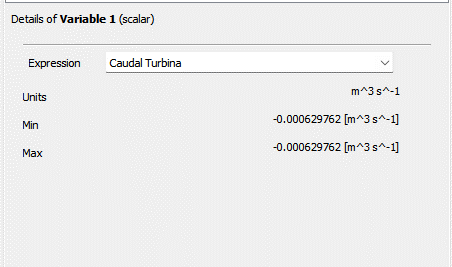
After defining the Expression, I created a scalar Variable by selecting the Expression.
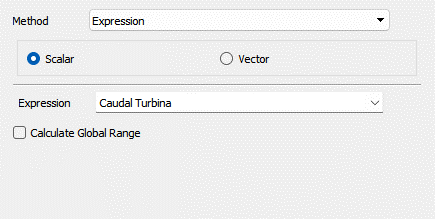
Then, I created the Transient Chart. The following print-screens show the selected options I’ve set.
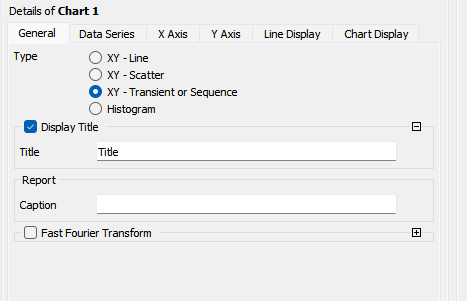

The generated chart was as it follows:
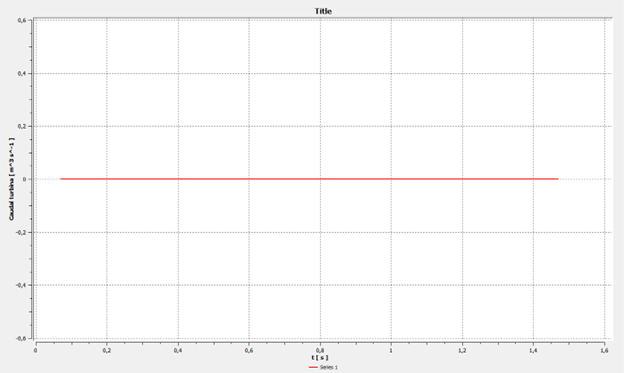
It seems that the software doesn’t read, or doesn't show the different result values of the expressions for each time-step.
I already checked that the result value of expression changes as I change the current time-step. I also tried to multiply the expression by 1000 to get higher values but the same thing happens.
Can anyone help me with this task? Is there something that I’m missing?
Thank you


