-
-
October 8, 2023 at 12:40 pm
uzmayaqoob1960
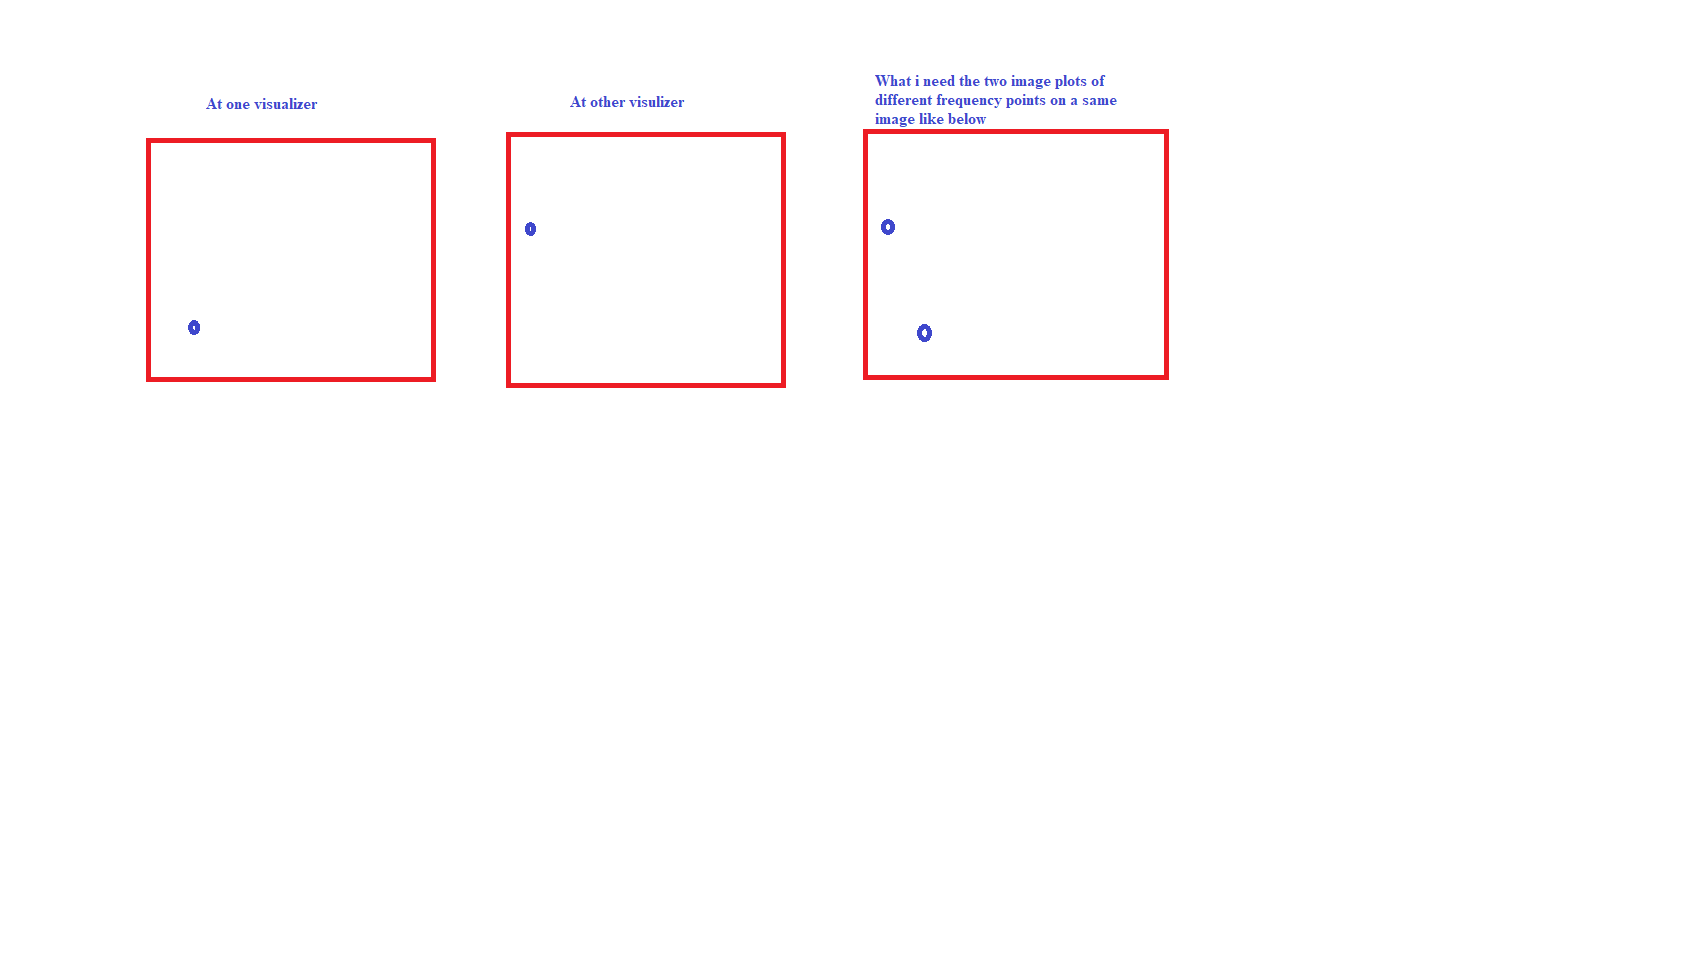
Subscribera single figure.Justlike in case of plot function we can holdon different plots on a single figure .Plz can nayone guide me in this regard?
-
October 9, 2023 at 4:55 pm
Dev
Ansys EmployeeHello,
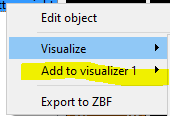
Yes, After visualizing 1st result using " Visulaize" option, you can use "Add to visualize" option to view the 2nd graph.
or you can use script : add2visualizer - Script command – Ansys Optics
Regards
Devika
-
October 9, 2023 at 7:53 pm
-
October 9, 2023 at 8:01 pm
Dev
Ansys EmployeeCan you elaborate a bit more about what 2 graphs you are plotting. A proper screenshot with X-Y axis also will be helpful here.
plot the result as two graph and send a screenshot.
-
October 9, 2023 at 8:42 pm
-
October 9, 2023 at 8:48 pm
Dev
Ansys EmployeeUzma Yaqoob,
Thanks for sharing the screenshot of result. Are you rerunning same simulation at another wavelenth here?
Also are you using same monitor?
From what I understand, I can suggest to create another monitor and set the 2nd frequency.
Then run the simulation and view the 1st frequency result using Monitor 1.
”Add to visualize” option to view the 2nd monitor result.
Let me know if that solved the problem.
-
October 10, 2023 at 4:09 am
-
October 10, 2023 at 4:23 am
Dev
Ansys EmployeePlease answer these question:
Are you rerunning same simulation at another source wavelenth here?
With forum we are trying to answer without simulation files so please share maxium informtaion as possible. Thats why I am asking all these questions to understand the simulation.
You can follow this guidline:
Ansys Insight: Ansys Innovation Space —- Forum and Feed
-
October 10, 2023 at 4:38 am
uzmayaqoob1960
Subscribermeans same file( single)
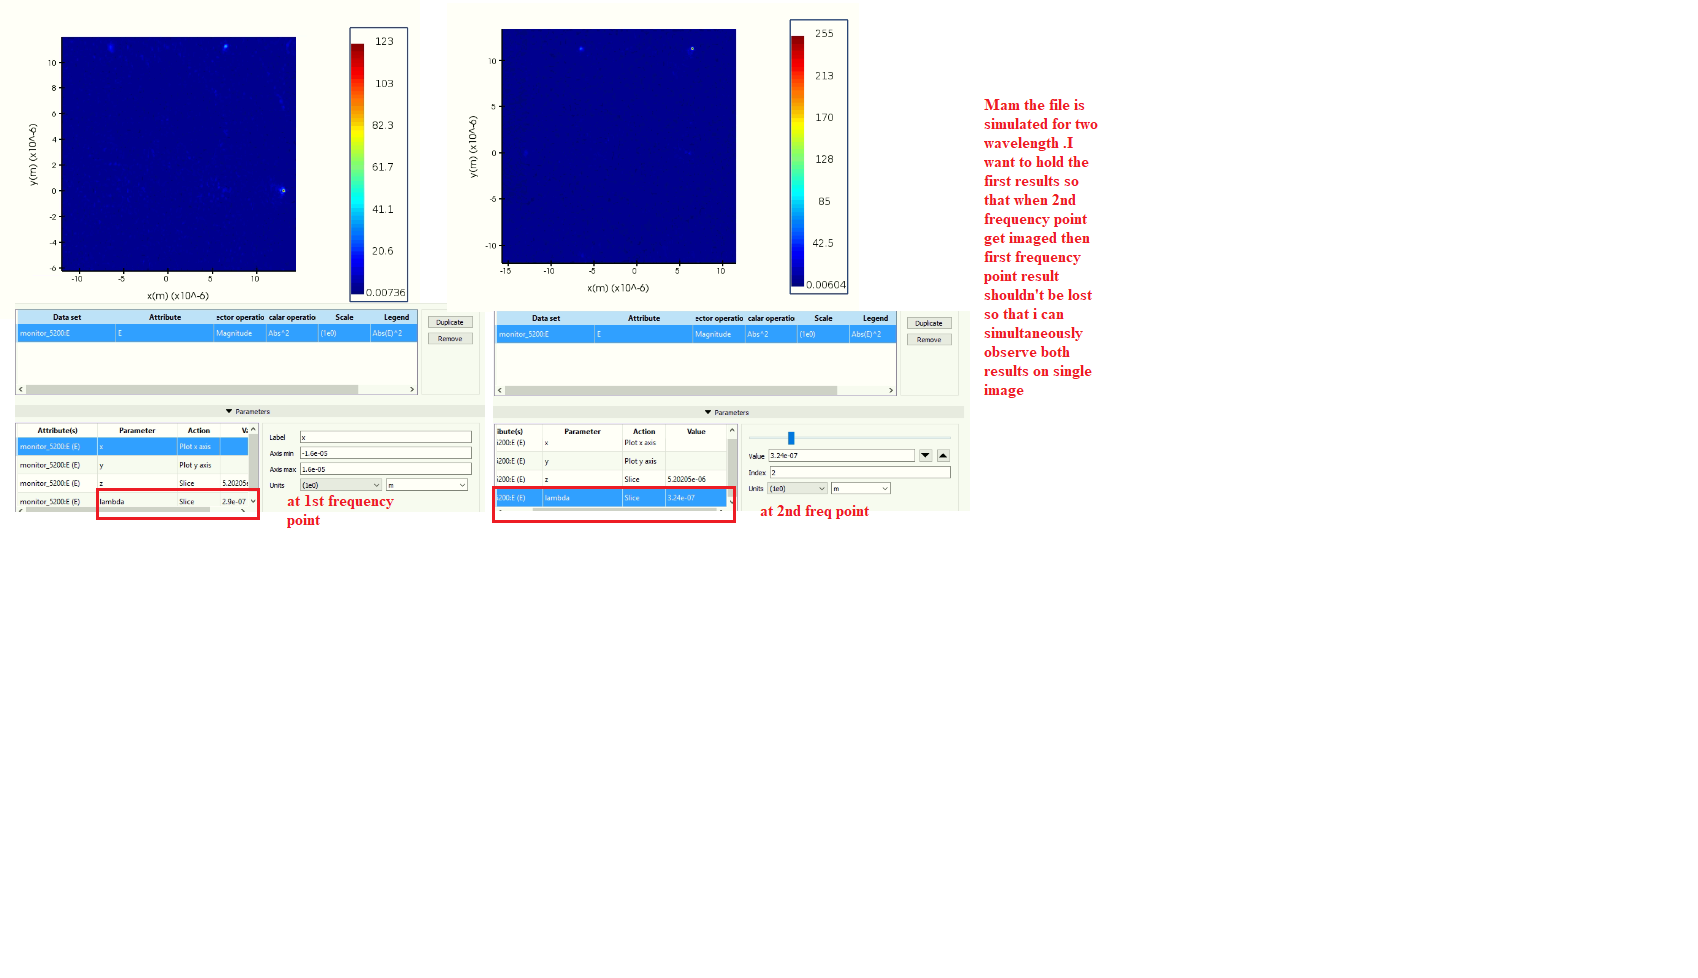
is being simulated simultaneously for two different wavelengths by setting freq points.Thanks
-
-
October 10, 2023 at 4:37 am
uzmayaqoob1960
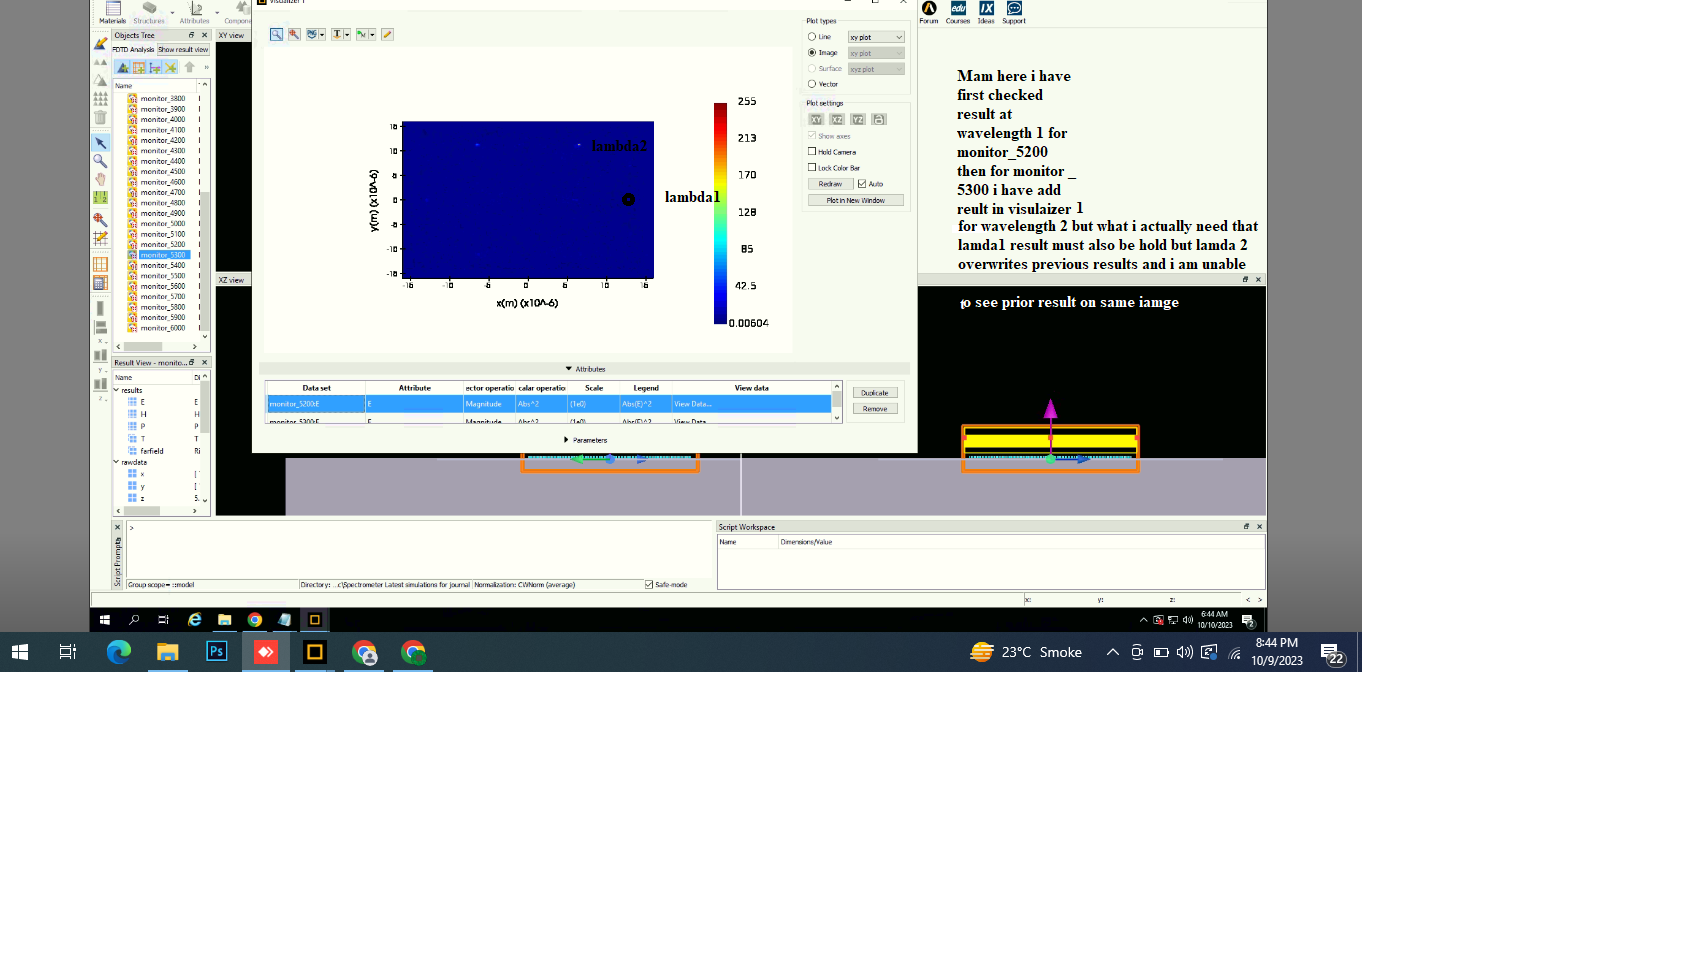
SubscriberNo mam i am running the same file for different wavelengths.Like i set source start freq=360nm and end freq=420nm.Then i add monitors and instead of global monitor settings i use override global monior settings with two frequency points .And then i put my file on simulation.Once done i can see the results on freq1 first and then using slider against lamda i can see the results for freq 2 as my monitors are saving results for both freq points .Now my intent is to see bth frequency results on the same image so that i can differentiate b/w them just like in hold off we can see multiple plots on single plot.I hope this will work.
-
October 10, 2023 at 4:56 am
Dev
Ansys EmployeeThanks for the explanation. Basically its overlap analysis.
To calculate the overlap, you can use mode expansion monitor to get the mode decomposition:
Using and understanding Mode Expansion Monitors
Mode expansion monitor - Simulation object - Lumerical Support
Monitors - Mode Expansion - Setup & Tips - Lumerical Support
Monitors - Mode Expansion - Results & Applications
Or the better, simply use port: Ports (FDTD) - Simulation Object
Port has mode source from FDE, DFT monitor and mode expansion monitor.Hope this will solve the problem.
-
October 10, 2023 at 5:40 pm
Dev
Ansys EmployeeHello Uzma Yaqoob,
I discussed with the team. Solution is: “Visualizer cannot hold the plots at two different wavelengths in the same figure. Script will be needed with plotxy, not plot”.
Please note: We use pulse and Fourier transform to get frequency-domain results.
Sorry for the confusion.
Regards
Devika
-
October 14, 2023 at 7:07 pm
uzmayaqoob1960
Subscriberok many thanks mam .plotxy will hold data for two wavelengths?
-
October 16, 2023 at 6:25 pm
Dev
Ansys EmployeeHello,
Thanks for the update and I am glad to hear issue is solved. I am closing the post.
Thansk for using the forum.
Regards
Devika
-
- The topic ‘Can anyone plz guide that can we hold images for different frequency points on a’ is closed to new replies.


-
4833
-
1587
-
1386
-
1242
-
1021

© 2026 Copyright ANSYS, Inc. All rights reserved.


