-
-
September 4, 2021 at 7:40 am
Thirumoorthy
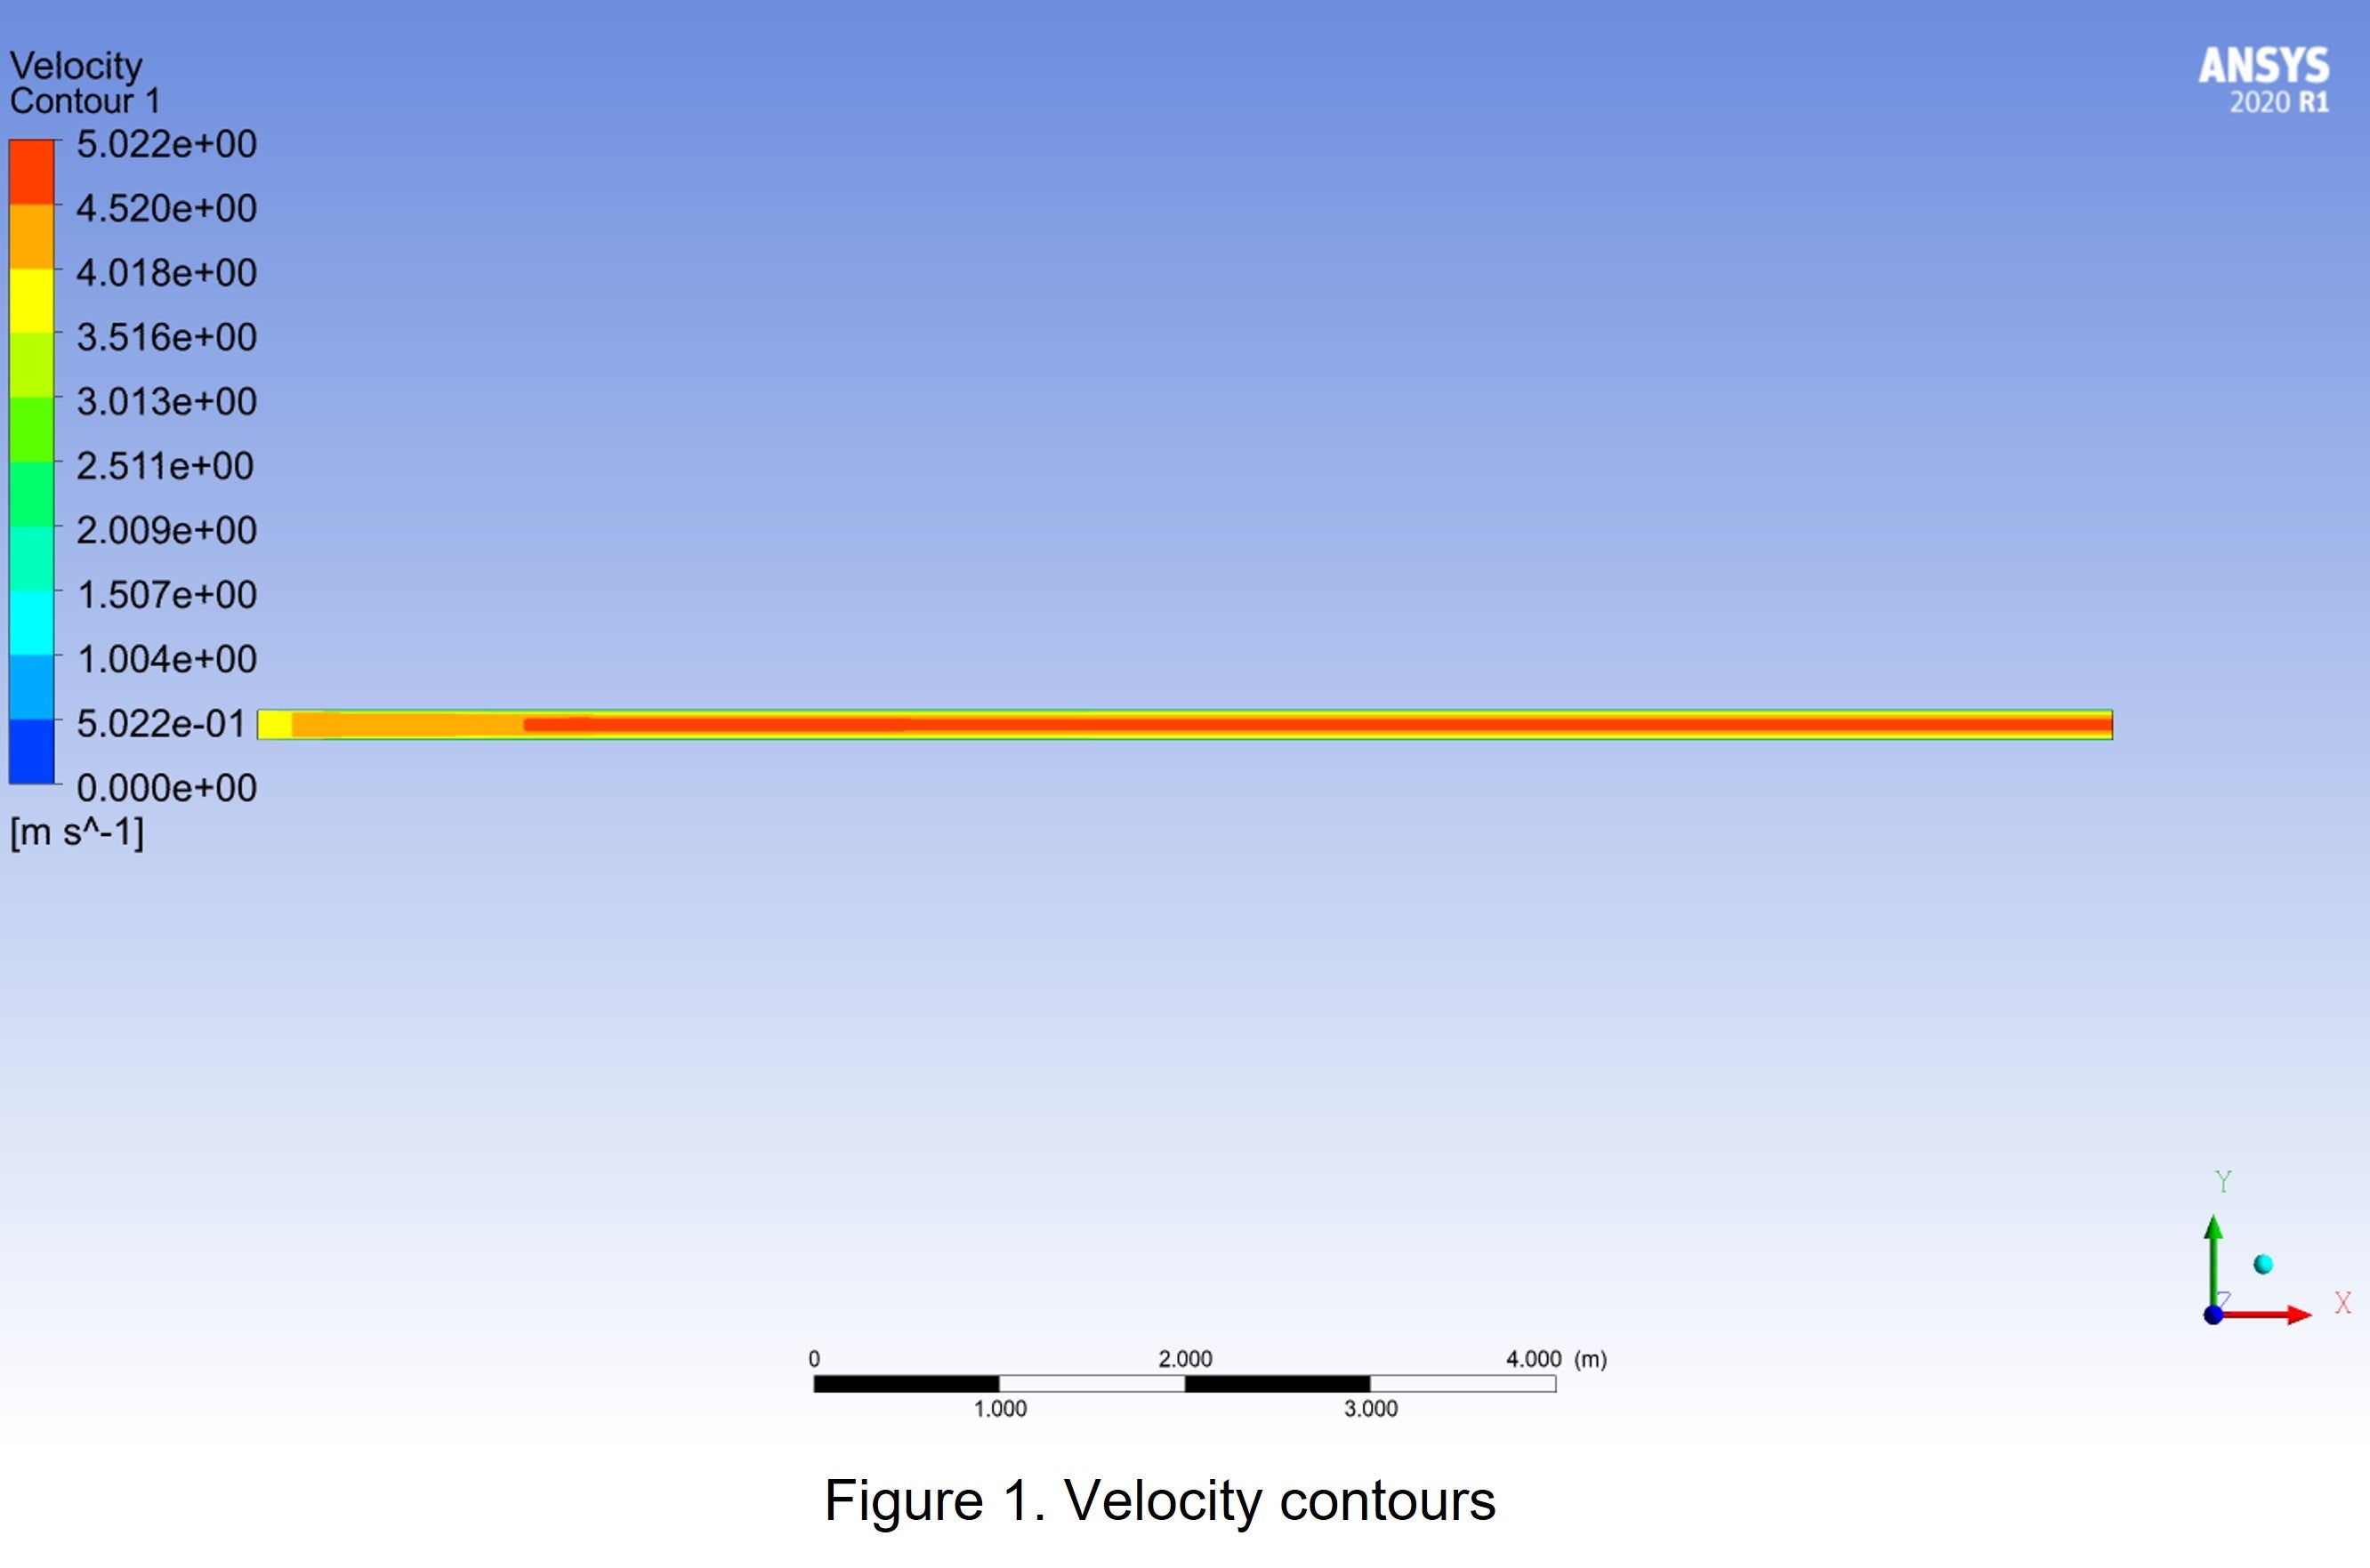
SubscriberSimulating a three-dimensional turbulent flow in a circular pipe whose diameter and length are 0.16 meters and 10 meters respectively. The Reynolds number is in order of 10^5. Here the aim is to find the entrance length for a given pipe.
Models used in fluent: k-epsilon, RNG, and standard wall functions.
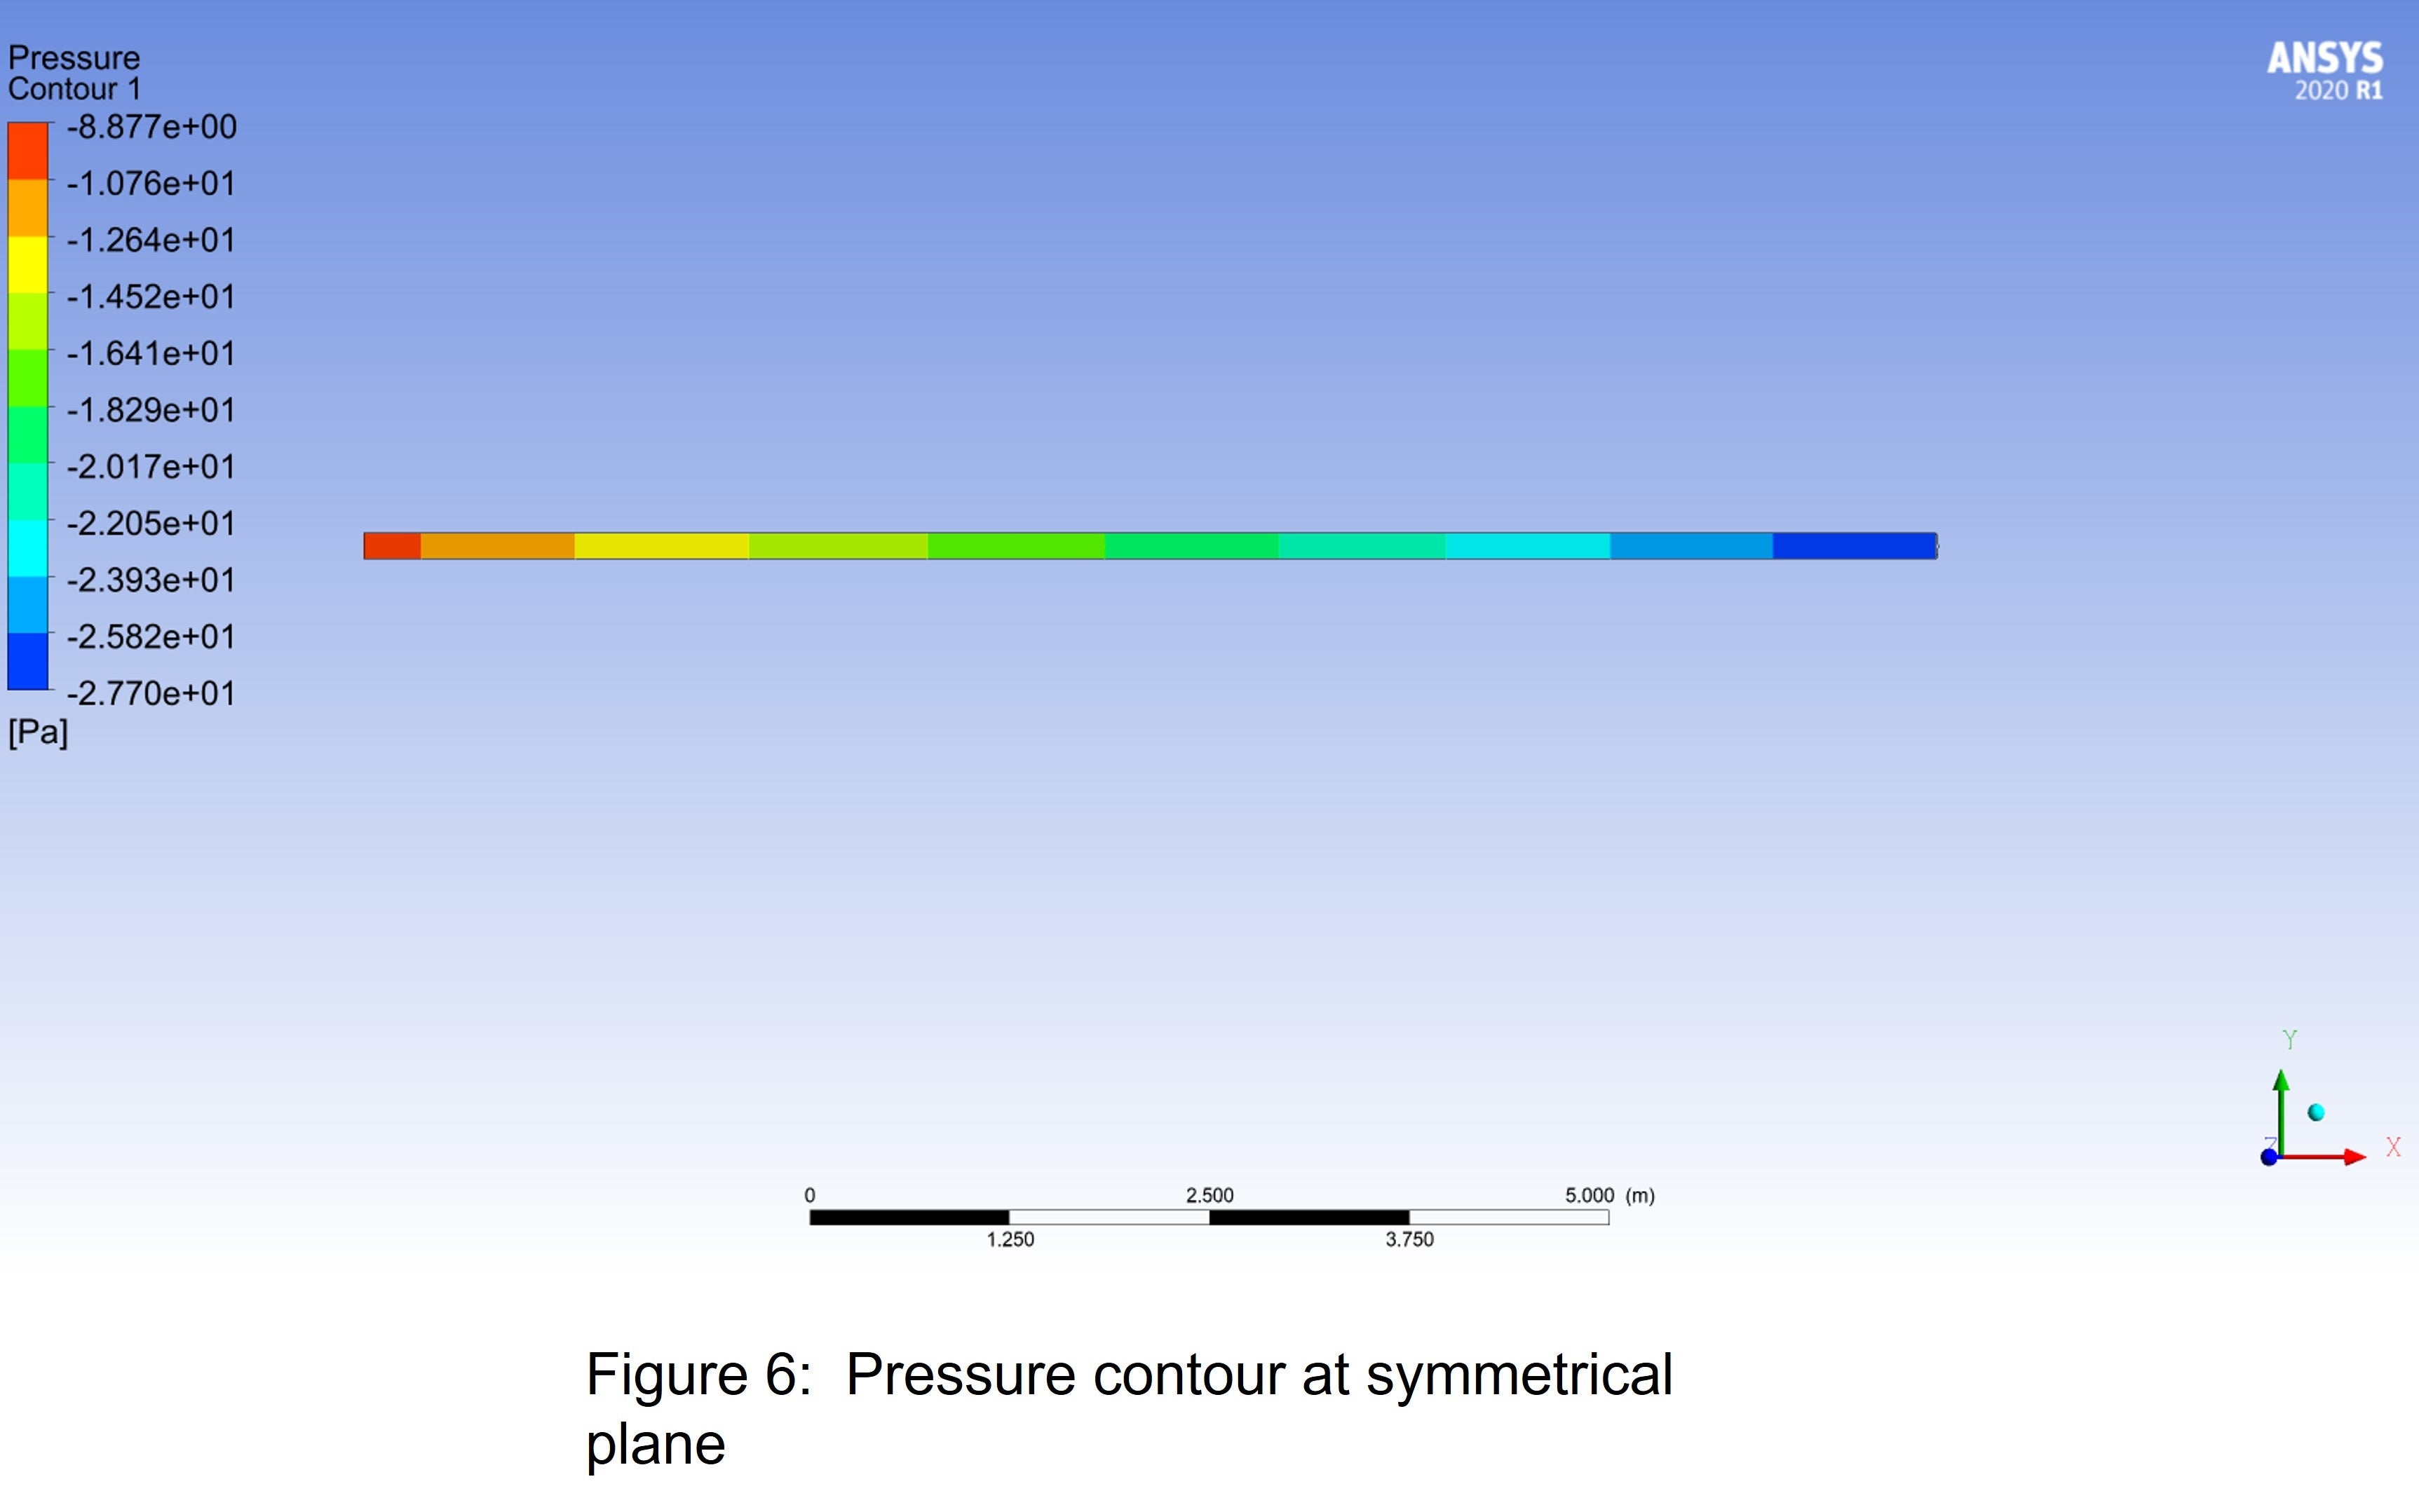
Boundary conditions: Inlet --> 0 Pa (gauge pressure), and outlet --> -27.7 Pa.
Wall y+ plus avearge value: between 5 to 10
Velocity contours are plotted at the symmetrical plane of the pipe, see figure 1. Velocity across the flow for regular intervals of length from upstream of the pipe is plotted in figure 2. In figure 3, shows the close view of figure 2, shown the maximum velocities regions away from walls.
September 6, 2021 at 6:55 amaitor.amatriain
SubscriberHave you performed a mesh-independence study?
In regards to your questions:
1) The approximation L_el=10*D is just an approximate value. You can check on the literature that other authors propose values even higher than 100*D. These correlations depend highly on the particular problem, so you should take them as an order of magnitude. In your case L_el=25*D, so it makes sense.
2) Could you please explain the difference between the two plots?
September 6, 2021 at 8:48 amSubscriberYes, I had performed the grid-independence test.
Entry length (L_el) of above 15 times (say 25 or 100 times) of duct diameter occurs for laminar and transition flows. Entry length of 10 to 15 times of duct diameter is appropriate for higher Reynolds (>=10,000). In my study, I am getting Re=10^5.
Figure 2: The plot for velocity across the flow or pipe at different lengths of pipe.
Figure 3: Same plot of figure 2, just narrowed the velocity (in Y-axis) between 4 to 5 m/s. This is to show how velocity is shooting up and comes back with respect to the length of pipe.
September 6, 2021 at 9:37 amSubscriberCould you please show some pictures of your simulation? Residuals, contours of pressure and velocity (including the mesh)...
Have you tried to use k-omega SST model?
September 6, 2021 at 10:19 amRob
Forum ModeratorI don't like the way the curves seem to facet as they level off; I agree with we need more information including an image of the mesh on the symmetry plane so we can see the cell sizing.
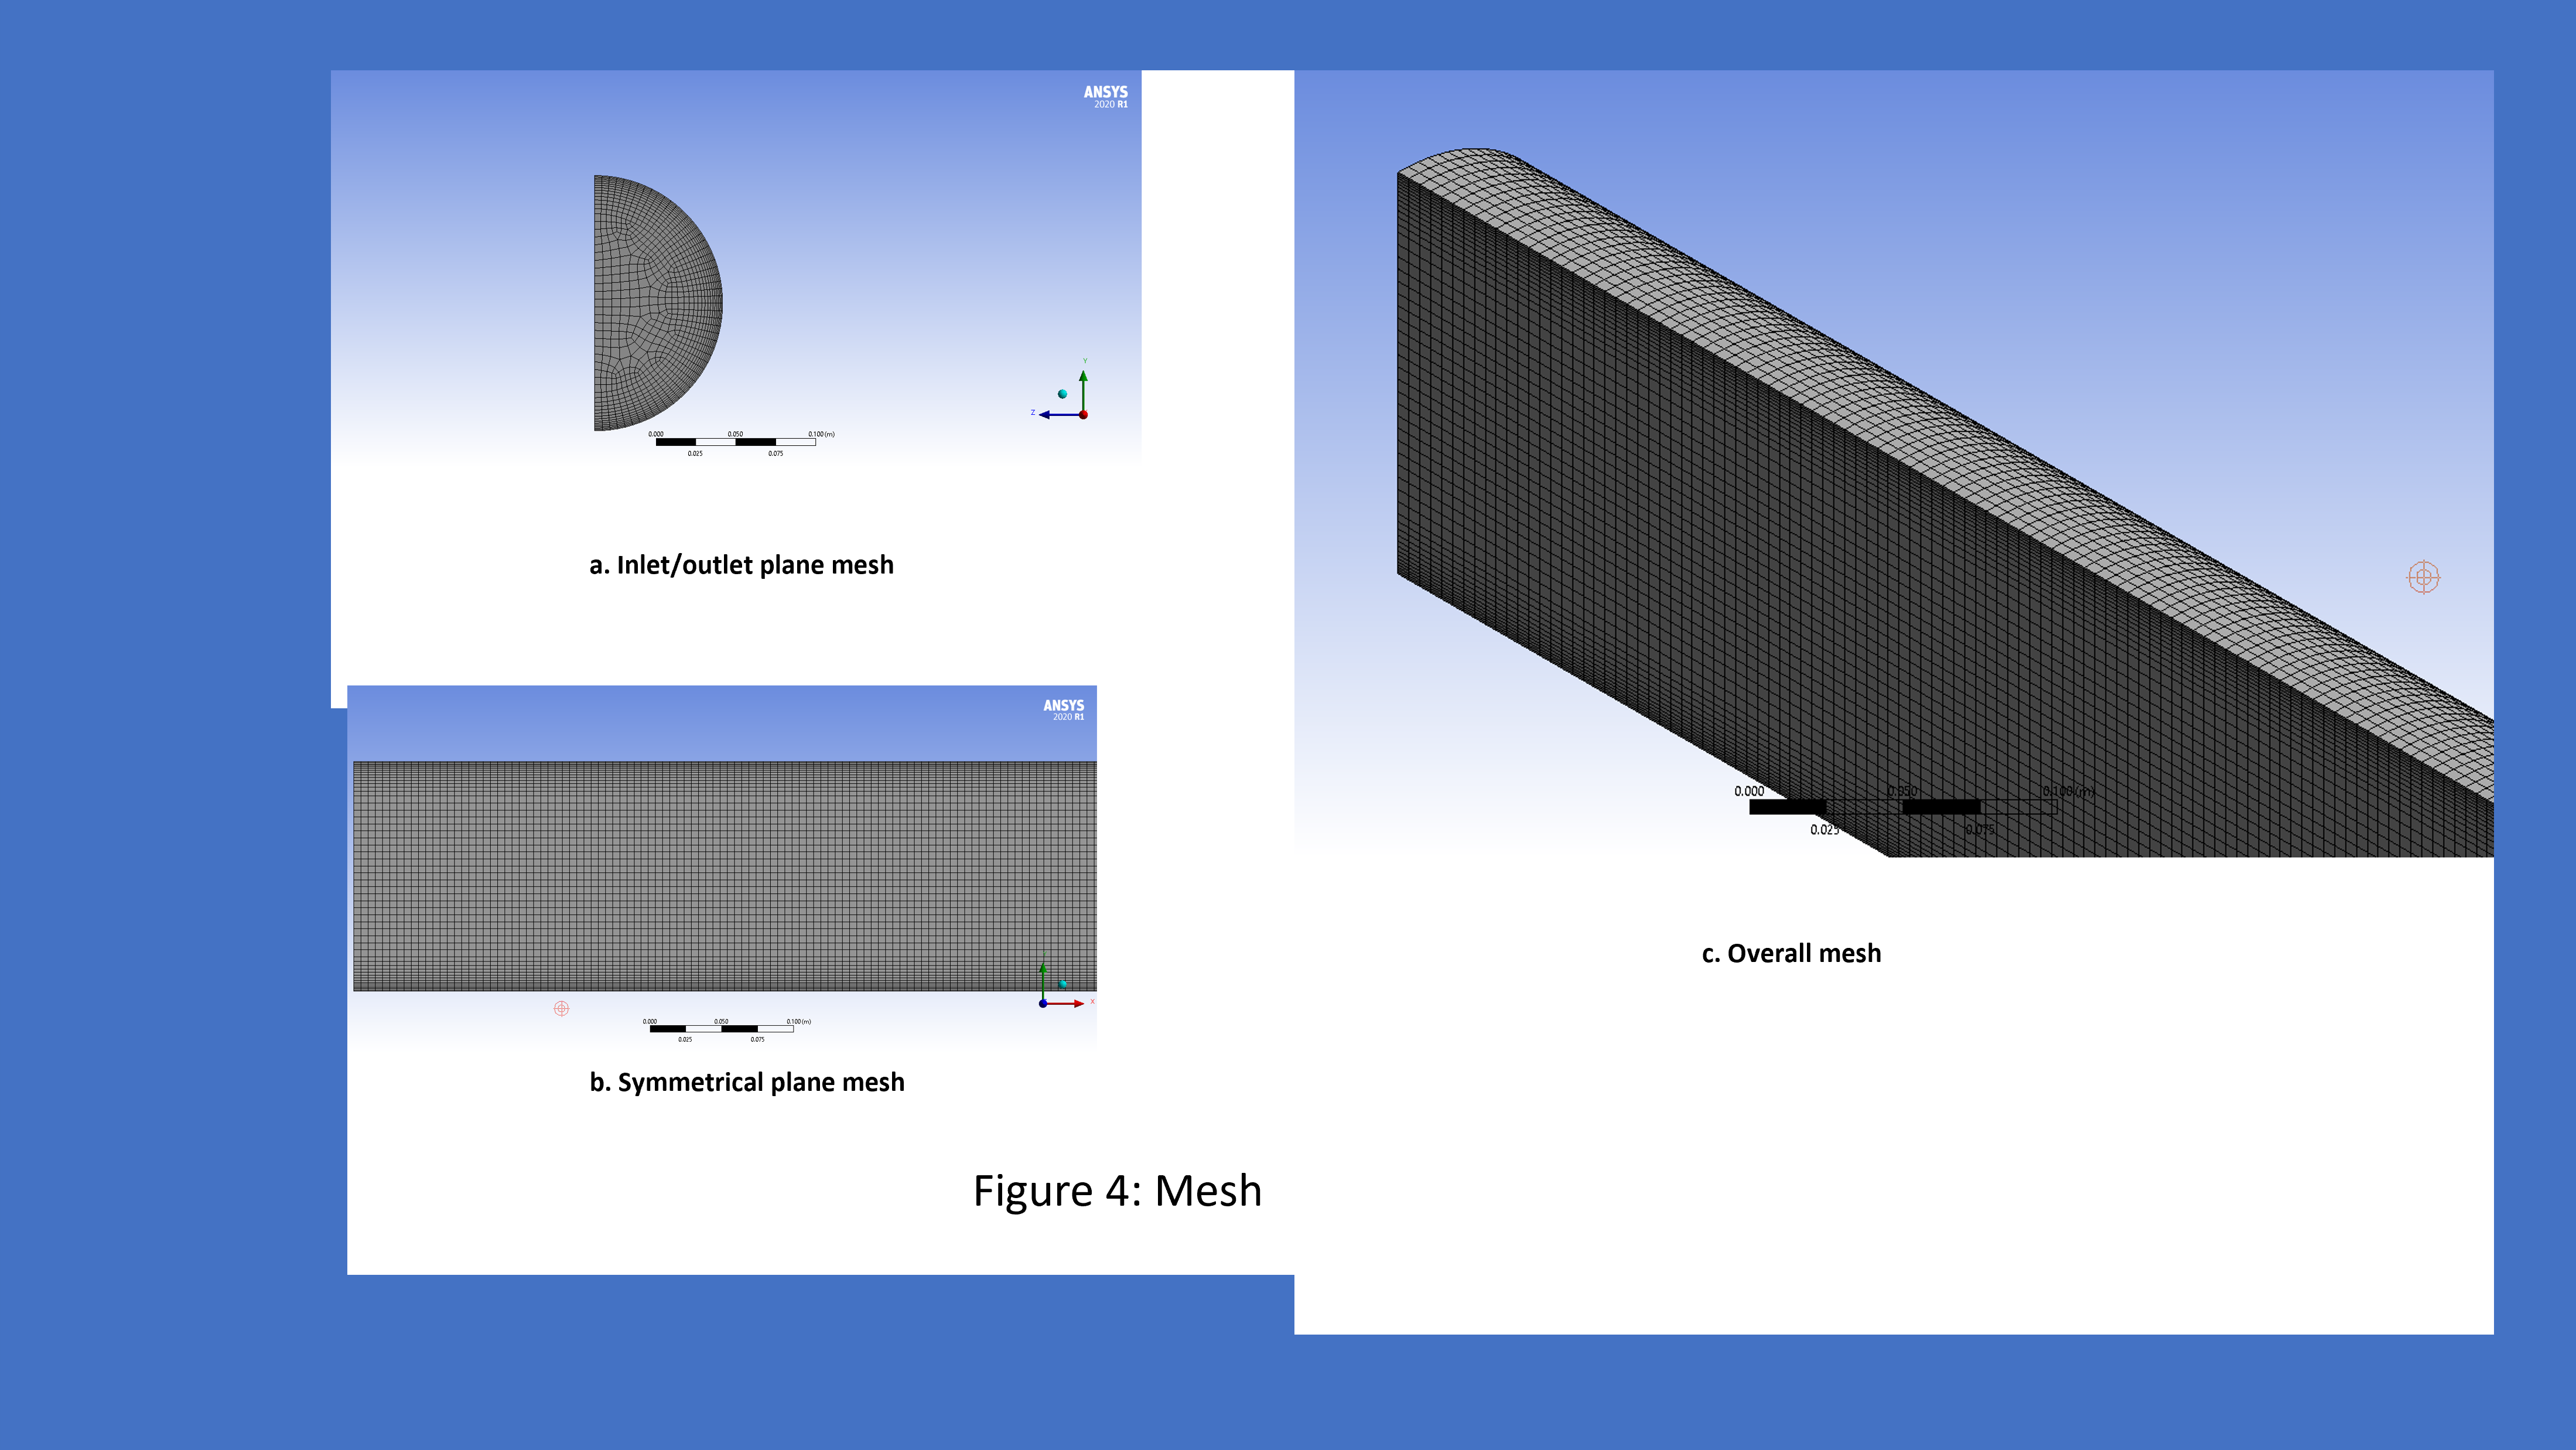
September 8, 2021 at 6:44 amSubscriberand Figure 4 shows the mesh for circular pipe, whose element size is 5mm. Multizone and Inflation are used.
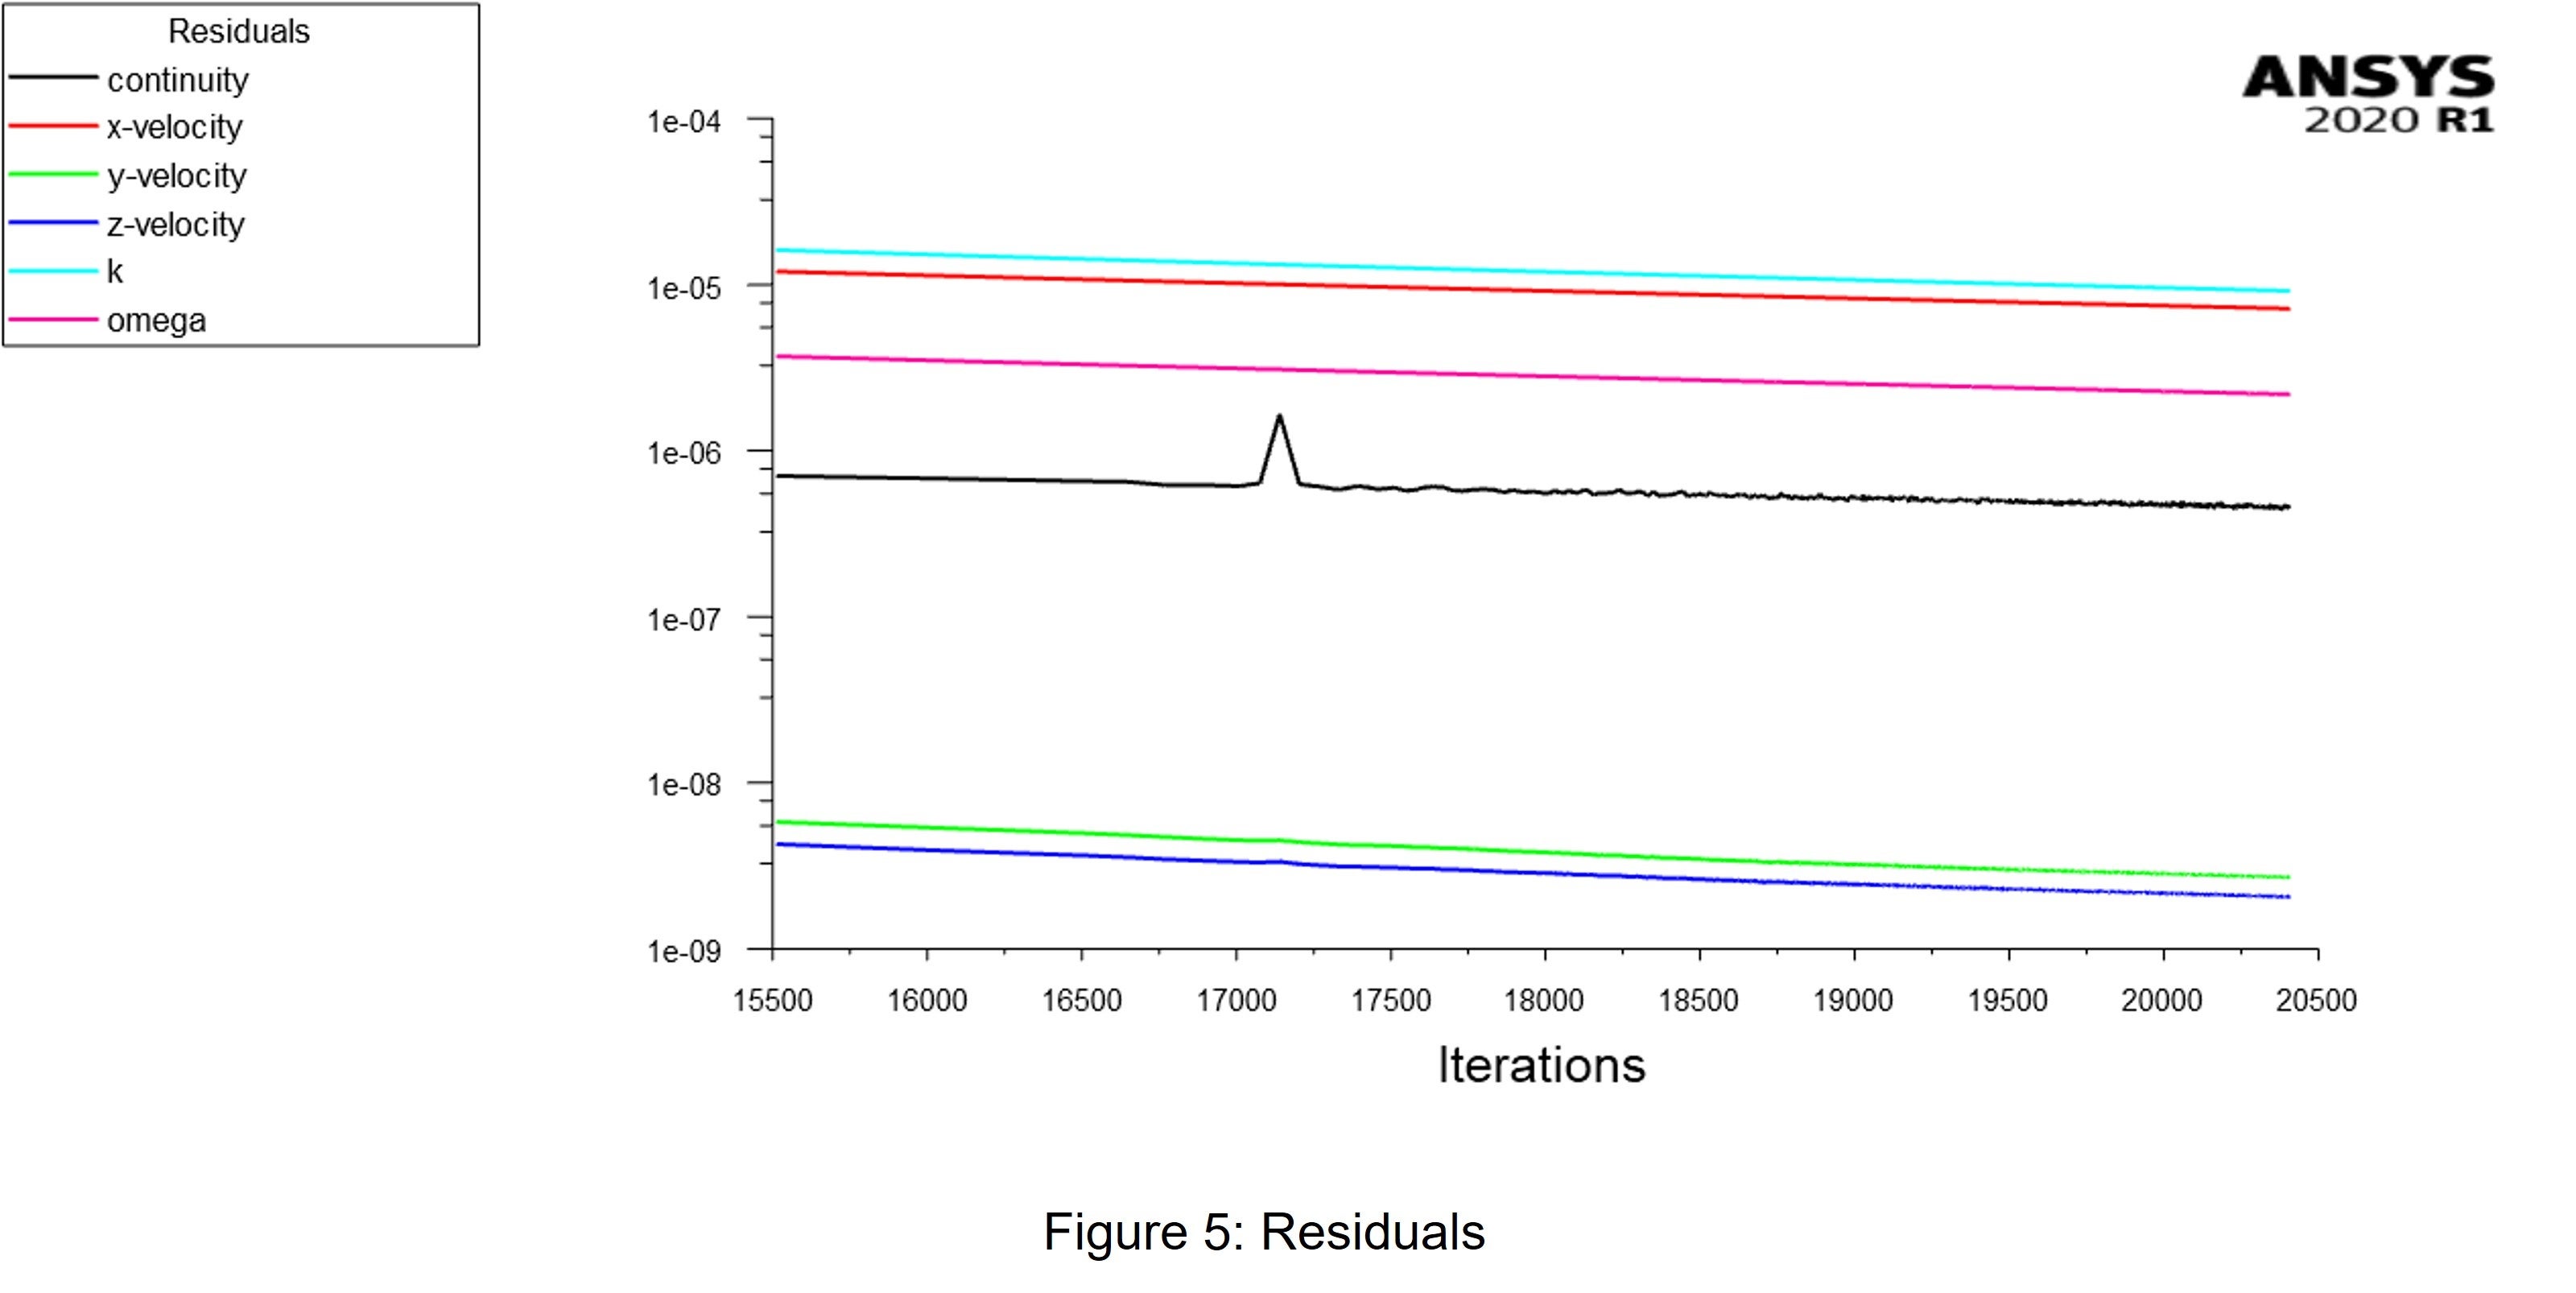
I have tried SST, k-omega model, the corresponding model's residuals are shown in figure 5. There is no significant results difference between SST k-omega and RNG k-epsilon.
Pressure contours at the symmetrical plane are shown in figure 6.
Velocity contours at the symmetrical plane were already is shown in figure 1, in the first post of this discussion.
Can you figure it out where was the mistake?
September 13, 2021 at 11:54 amSubscriberand pls remembering you to give solution to my problem.
September 13, 2021 at 12:14 pmSubscriberHave you tried a 2D axysimmetric case or the full 3D?
September 13, 2021 at 12:38 pmSubscriberI tried 3D symmetric case
September 13, 2021 at 3:09 pmSubscriberI recommend you to try these two cases.
September 13, 2021 at 4:29 pmForum ModeratorMesh looks OK. Can you post a screen grab of the settings you use to get the data for the plots? Ie what EXACTLY are you plotting.
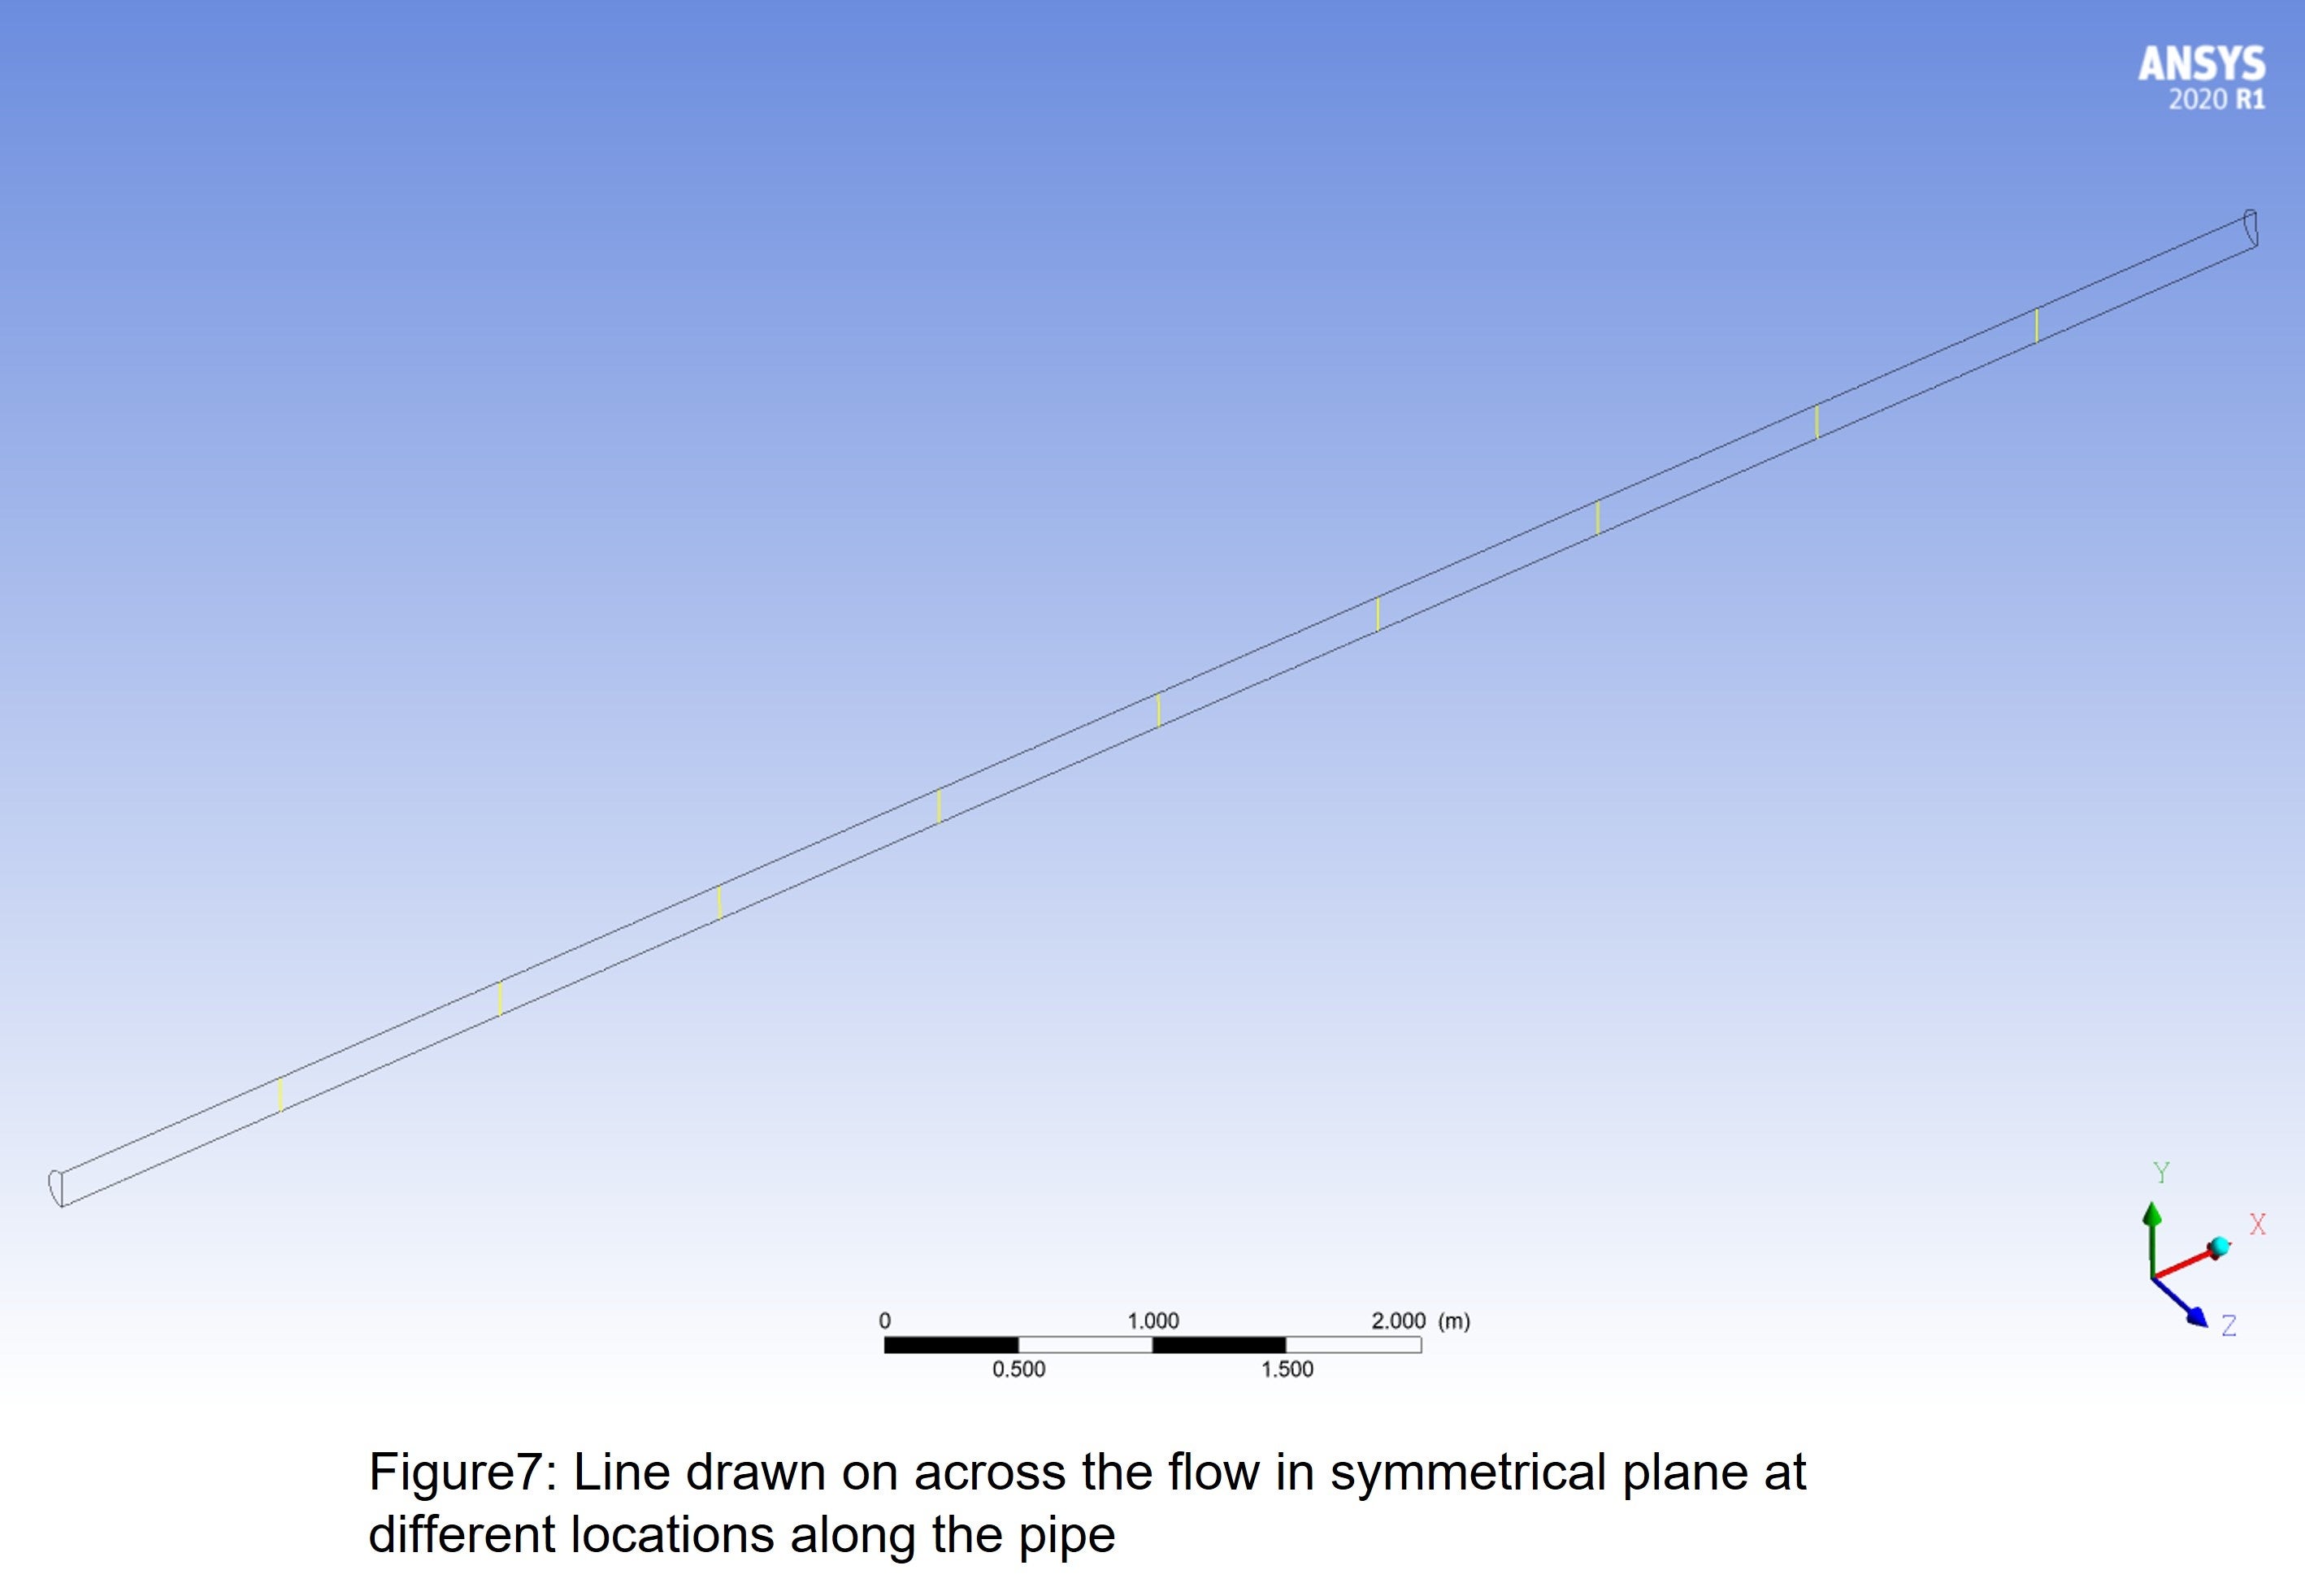
September 14, 2021 at 6:15 amSubscriberThe yellow lines shown in figure 7, on the symmetrical plane, are the data (velocity) extraction lines for different locations along the pipe.
September 14, 2021 at 6:39 amSubscriberI was thinking about maybe the symmetric mesh is forcing the solution to values that are not realistic. I am not a big fan of 3D symmetric cases, by the way.
September 14, 2021 at 7:39 amSubscriberI had tried both 2D axisymmetrical and full 3D cases still the results are the same. I guess it needs to revise the models which I am using. I used k-epsilon, RNG, and standard wall functions, and also tried SST k-omega. I have also tried changing the boundary conditions, but still, the results are same.September 14, 2021 at 10:43 amForum ModeratorOK, please can you post a screen grab of the xy plot panel: I want to see what you're plotting.
September 14, 2021 at 11:14 amSubscriber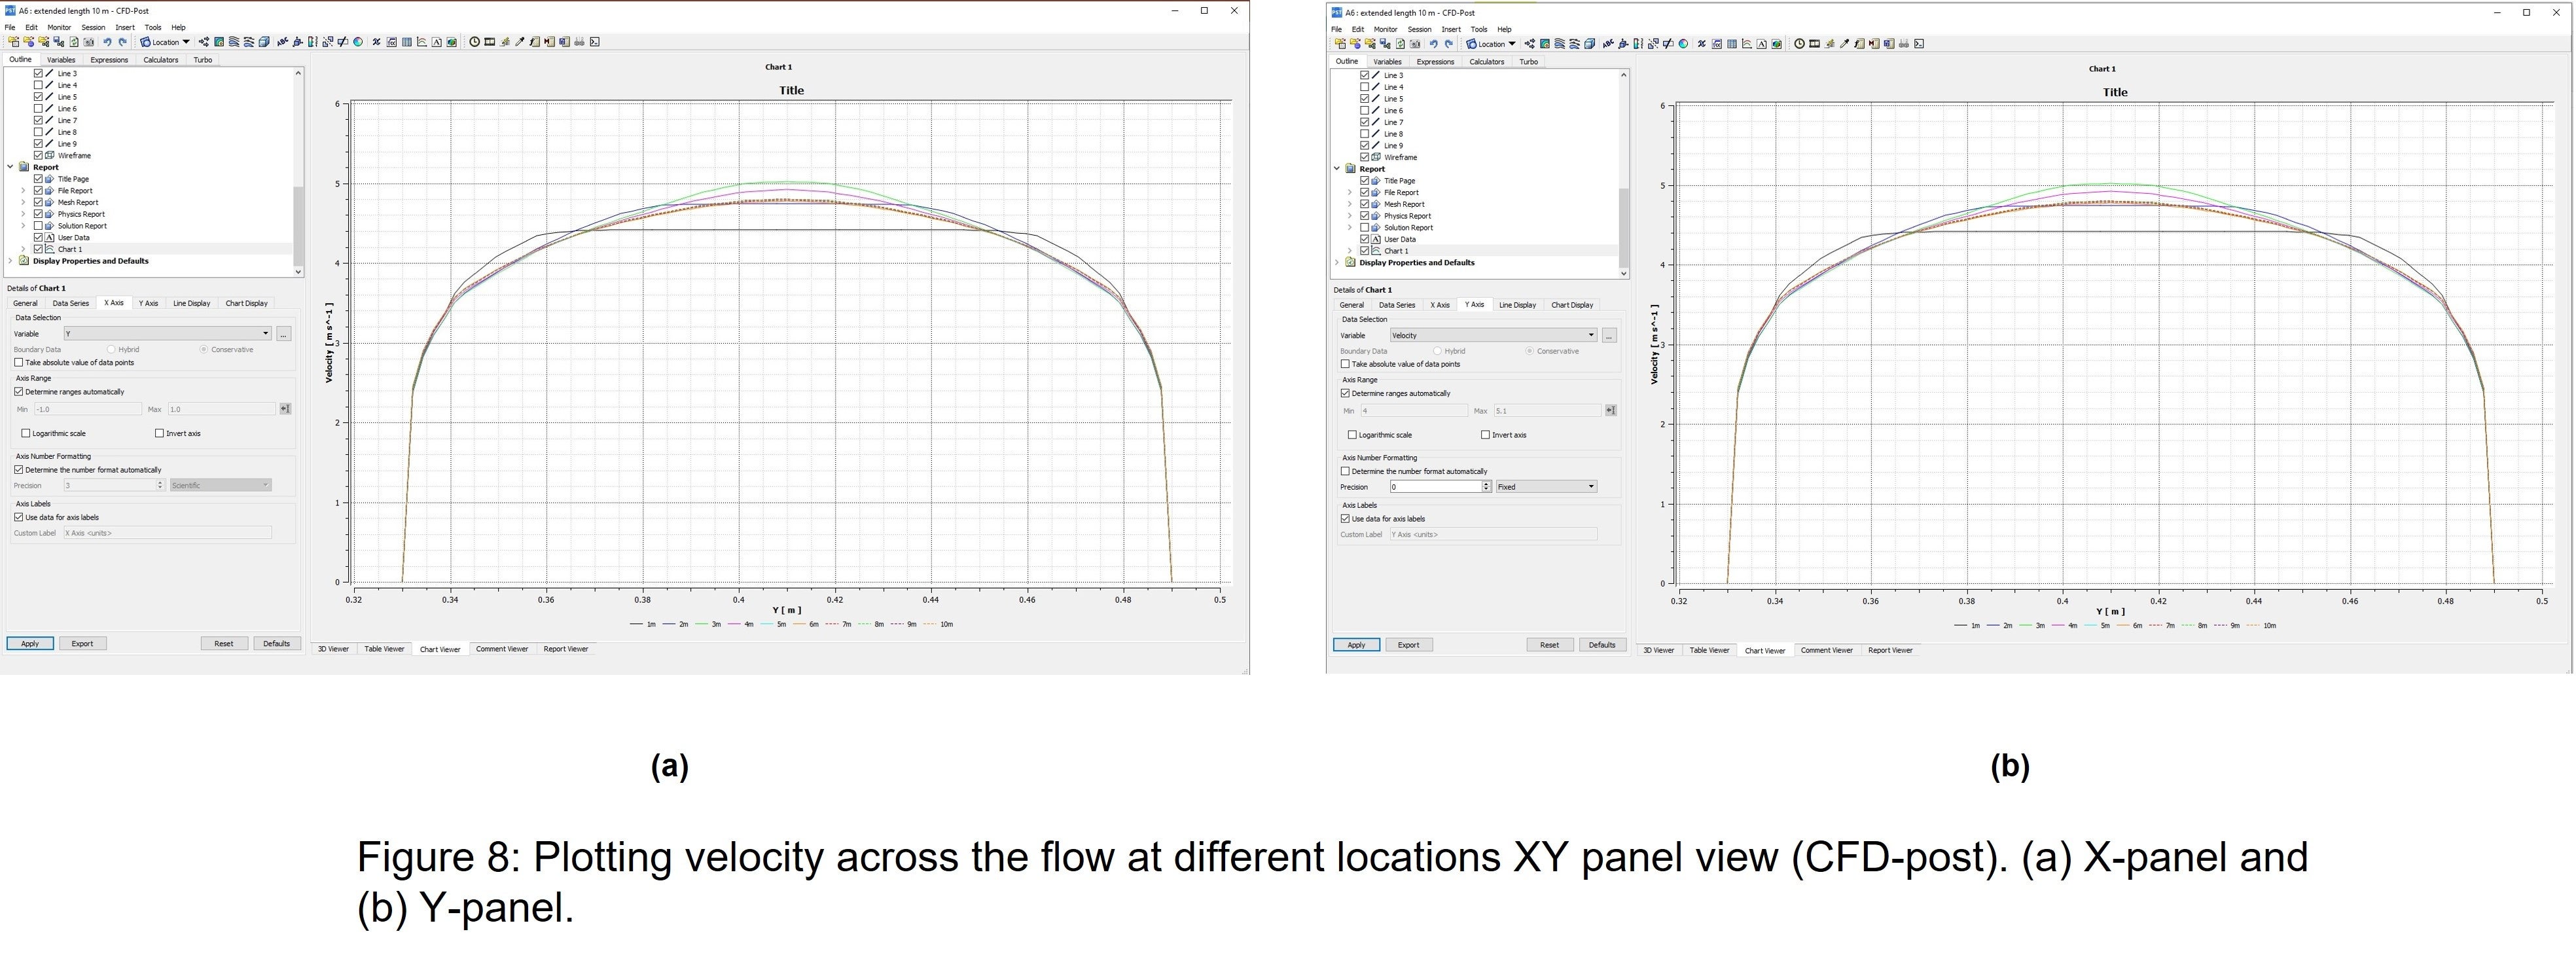 Please see figure 8.
September 14, 2021 at 11:58 amForum ModeratorDid you run this in CFX or Fluent?
September 14, 2021 at 12:03 pmSubscriberI used fluent
September 14, 2021 at 1:11 pmForum ModeratorOK, use the xy plot feature in Fluent and see how the curves compare.
September 14, 2021 at 1:33 pmSubscriberYes, both the fluent and CFD post processing are giving the same plots
September 14, 2021 at 4:30 pmForum ModeratorWhat turbulence settings did you put on the inlet?
September 15, 2021 at 9:33 amSubscriberIn inlet, default range: turbulent intensity is 5%, and turbulent viscosity ratio is 10.
September 15, 2021 at 9:36 amForum ModeratorTry 3% and use hydraulic diameter.
September 15, 2021 at 10:35 amSubscriberb I tried 3% turbulence intensity and hydraulic diameter at the inlet still, the results are same.
September 15, 2021 at 3:19 pmForum ModeratorIn which case I think the solver is giving the numerically correct answer for your set up, and it's taking longer for the flow to develop. We usually use a velocity inlet & pressure outlet as exclusively using pressure boundaries makes the mass flow a part of the solution rather than part of the set up, so see if setting the inlet velocity alters anything.
September 16, 2021 at 4:43 amSubscriberI had tried velocity inlet and atm pressure as an outlet. And also tried mass flow as an outlet and atm Pr as an inlet. Still the results are same.
Viewing 25 reply threads- The topic ‘Calculating entrance length in the fully developed turbulent flow in a long pipe – 3D’ is closed to new replies.
Innovation Space Trending discussions
 Top Contributors
-
peteroznewman
 6450
6450 -
scabo
 1906
1906 -
Dennis Chen
 1457
1457 -
javat33489
 1308
1308 -
Shyam Prasad V Atri
1022
Top Rated Tags
© 2026 Copyright ANSYS, Inc. All rights reserved.
Ansys does not support the usage of unauthorized Ansys software. Please visit www.ansys.com to obtain an official distribution.
-
Ansys Assistant will be unavailable on the Learning Forum starting January 30. An upgraded version is coming soon. We apologize for any inconvenience and appreciate your patience. Stay tuned for updates.