-
-
July 22, 2024 at 5:28 pm
Scott Ormiston
SubscriberWe have a turbulent flow in a channel for which we would like to plot the axial variation of bulk temperature from inlet to outlet. The bulk temperature at a given axial location is the mass flow averaged temperature on a plane normal to the axial direction.
We want to do this in Fluent (in order to use the local bulk temperature as the T_ref in a local heat transfer coefficient calculation). Can you please tell me how we do the local bulk temperature calculation on a plane and then how to use it in a local heat transfer coefficient calculation.
(Aside: We did this type of calculation in the past in CFX using its Perl-like scripting language (a CCL Power Syntax Macro) with a loop that created local planes marching from the inlet to the outlet.)
-
July 23, 2024 at 1:46 pm
Rob
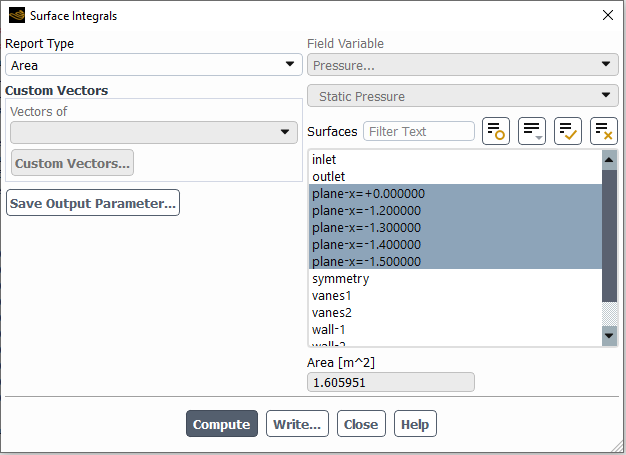
Forum ModeratorIt's the Surface Reports. If you choose mass weighted average for all the surfaces (iso-surface or plane) the report in the console will be per surface.
If you then want to calculate the HTC in Fluent there are Expressions that should do the same as CFX. Alternatively take the data from the console to Excel or similar. If you use an isosurface at the various positions you can also create that surface a second time & pick the wall when doing so to create a surface (line) to get the wall temperature (note, there are a few temperature options so check which one you want).
-
July 31, 2024 at 1:08 pm
Scott Ormiston
SubscriberHow does one create the set of axial planes on which to do the surface report? Is it possible to do multiple plane surface reports and write those results to a file while using a journal file? We think we would prefer to do it in Fluent if possible, but we are not sure. What is your view on doing it directly in Fluent versus loading the Fluent results into CFDPost and using the Power Syntax macro there?
-
July 31, 2024 at 1:19 pm
Rob
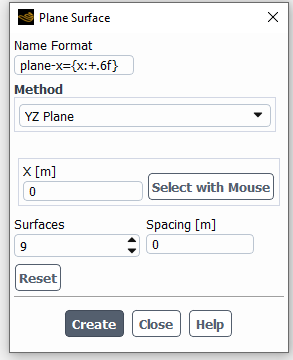
Forum ModeratorUse the Plane option
And pick a number of planes & spacing. That will give some surfaces. These can then be used for integrals
If you need the data during the run then you can use the Report Definition functions to either get a separate file for each or one larger file. Expressions can be used to get average values etc if you want to obtain other values.
We don't tend to use CFD Post much with Fluent data, with the possible exception of animations from existing data sets. I'd still use Fluent, but I've also got scripts/journals read case & data, create images, read next case & data etc.
-
July 31, 2024 at 1:28 pm
Scott Ormiston
SubscriberThank you. I will pass this along to my researcher and see how it goes.
Thanks for the advice. Do you find that you can get publication quality images from Fluent post processing? I guess I am biased because I used CFD Post for so long and found that it gave excellent output. We will soon be needing high quality output for our current project, so we will try Fluent first and see how it goes.
-
July 31, 2024 at 1:34 pm
Rob
Forum ModeratorCheck the options in File>Save Picture re resolution. I've not published anything for many years so am unsure what the current requirements are.
-
July 31, 2024 at 1:36 pm
Scott Ormiston
SubscriberCheers.
-
- The topic ‘Axial variation of bulk temperature in Fluent’ is closed to new replies.


-
3377
-
1052
-
1050
-
886
-
842

© 2025 Copyright ANSYS, Inc. All rights reserved.


