Ansys Assistant will be unavailable on the Learning Forum starting January 30. An upgraded version is coming soon. We apologize for any inconvenience and appreciate your patience. Stay tuned for updates.
Fluids

Fluids

Topics related to Fluent, CFX, Turbogrid and more.

AQWA: Acceleration and displacement output mismatch..

    • NVN NAMMA
      Subscriber

      Hi, This was the result in acceleration for a regular wave time response analysis of a model scale spar platform. 

      But the position response shown is of a different nature. The acceleration response I validated with my experimental results. but the position actual response is entirely different. why is this?. Please help me to sort this out.

      Also one more doubt. Why is the heave acceleration is non-zero at time =0s?


    • NVN NAMMA
      Subscriber

      I appreciate yout attention to this

    • Shuangxing Du
      Ansys Employee

      Not sure how you validated position results. The position at a specified time relates to the acceleration and the initial velocity and the initail position.  Can you have the heave acceleration/velocity/position results? The curve of the derivative of position time history should coincide with the velocity curve, and the derivative of velocity time history should be comparable to the acceleration.  Please do such check. and also make sure the initial velocity and the initail position in your numerical model is the same as those of your model test. 

      Another point is when you run Aqwa time domain analysis, in order to avoid the transient responses at the starting period of time, the wave amplitude ramp is defined (see 18.7. The WRMP Data Record - Wave Ramp for regular wave). This definition of the wave may cause your responses not to be exactly the same as the experimental results, as the envornment conditions between your numerical model and the model tests are not exactly the same.

    • NVN NAMMA
      Subscriber


      I validated experimental acceleration and simulated acceleration results. But the response(heave position) is not matching with the pattern of acceleration. If you see the two plots, the trend itself is wrong. From my understanding aqwa calculates acceleration and then integrates to position in its numerical tool?

      "The analysis involves meshing the total surface of a structure to create a hydrodynamic and hydrostatic model. Nonlinear hydrostatic and Froude-Krylov wave forces can then be calculated from this model at each time step in a simulation, along with instantaneous values of all other forces. These forces are then applied to structures via a mathematical model (i.e. a set of nonlinear equations of motion), and the resulting accelerations are determined 
      "

      Also if u see the acceleration plot its non zero at t=0. I gave initial ramping of 10 s. if u need any more screenshot of my simulation, I am happy to provide.


    • Shuangxing Du
      Ansys Employee

      Please check which time domain hydrodynamic response analysis you did. If it is Irregular wave response with slow drift, the first and second wave exciting forces will be used and the initial acceleration based on the RAOs will be included.  Please also check if your time domain analysis starting from the eqlibrium position.

      It is hard to compare the tendencies betweem acceleration and position. I wonder if you could output velocity response. The integration of acceleration with time will be the velocity, then the integration of velocity will be the position.


    • NVN NAMMA
      Subscriber


    • Shuangxing Du
      Ansys Employee

      The results are good after t=10s. Right?

    • NVN NAMMA
      Subscriber

      That is good. now we are back at our first question. Why the position time series showing different pattern than the acceleration time series?. I have used regular wave response in the analysis. for velocity also it is different. 


    • Shuangxing Du
      Ansys Employee

      As we discussed previous, please export these curves as .csv files. Then in Excel, please do the numerical derivative of position data and compare with your velocoty curve, which should be close or coincides.

      Then please do the numerical derivative of velocity data and compare with your acceleration curve, which should be close or coincides.

    • NVN NAMMA
      Subscriber

      As you said this is the displacement generated for the csv acceleration. but in the time domain results the displacement shown is different. what could be the reason.


    • Shuangxing Du
      Ansys Employee

      It is confused. In your previous data, as shown below, there is a trough of acceleration and there is a crest of position at t=30s , but in your latest data, the position at that time is a trough, the starting position (time=0) is also not the same as that in the previous data.  I never said that the position is purely generated by the acceleration. It also depends on the inital velocity and initial position. 

      Once again, please use position curve to find out velocity time history, and use velocity curve to find out the acceleration time history. If the derived results are comparable with the Aqwa generated data, you could confirm that the Aqwa data are Ok. The difference of the position data between Aqwa and your expeciment may come from the initial conditions and the definitions of wave ramp. 

    • NVN NAMMA
      Subscriber

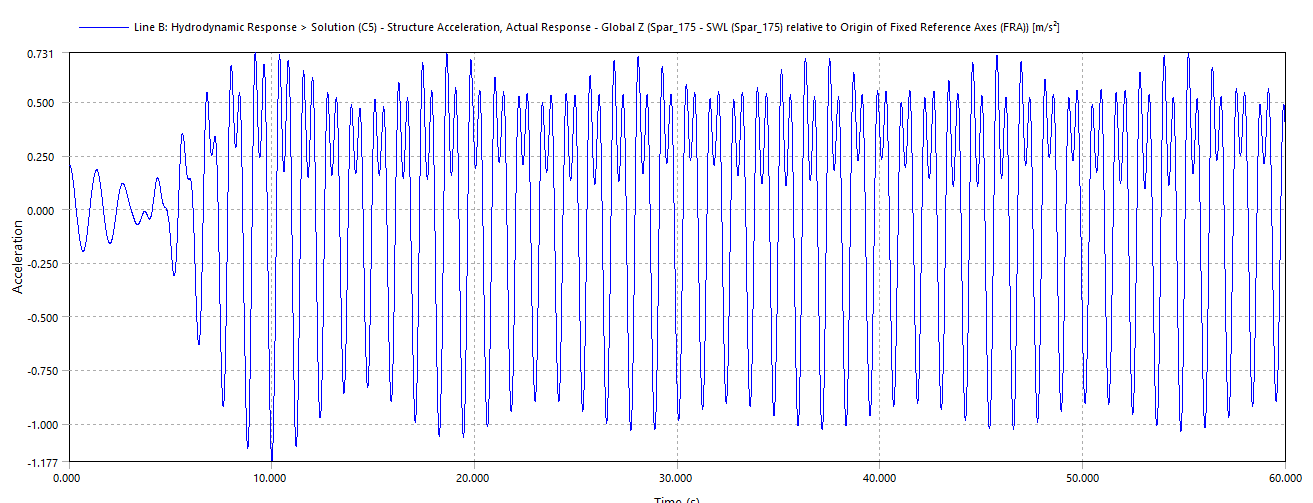
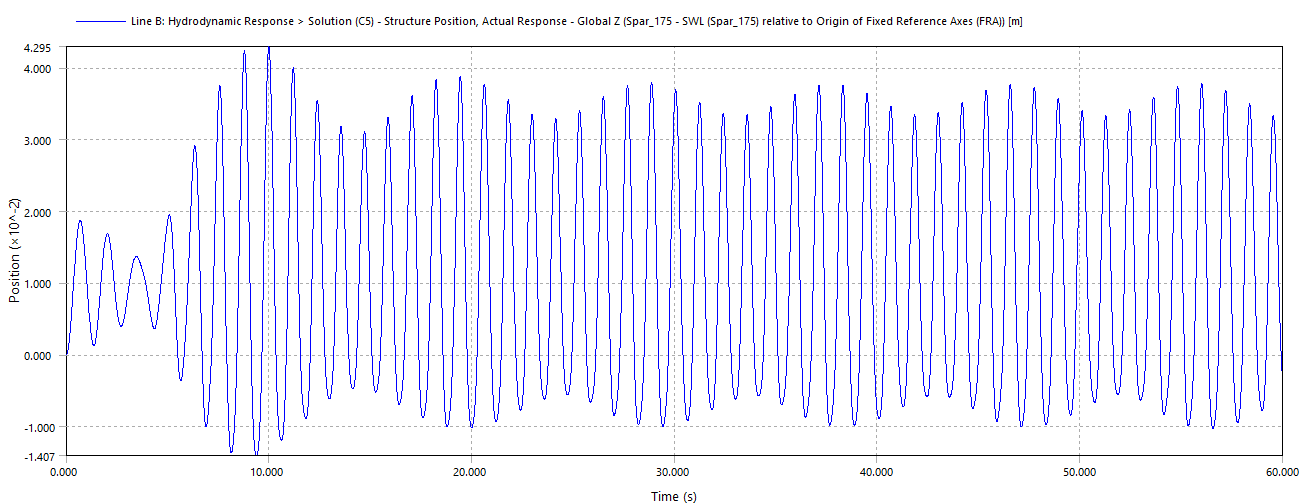
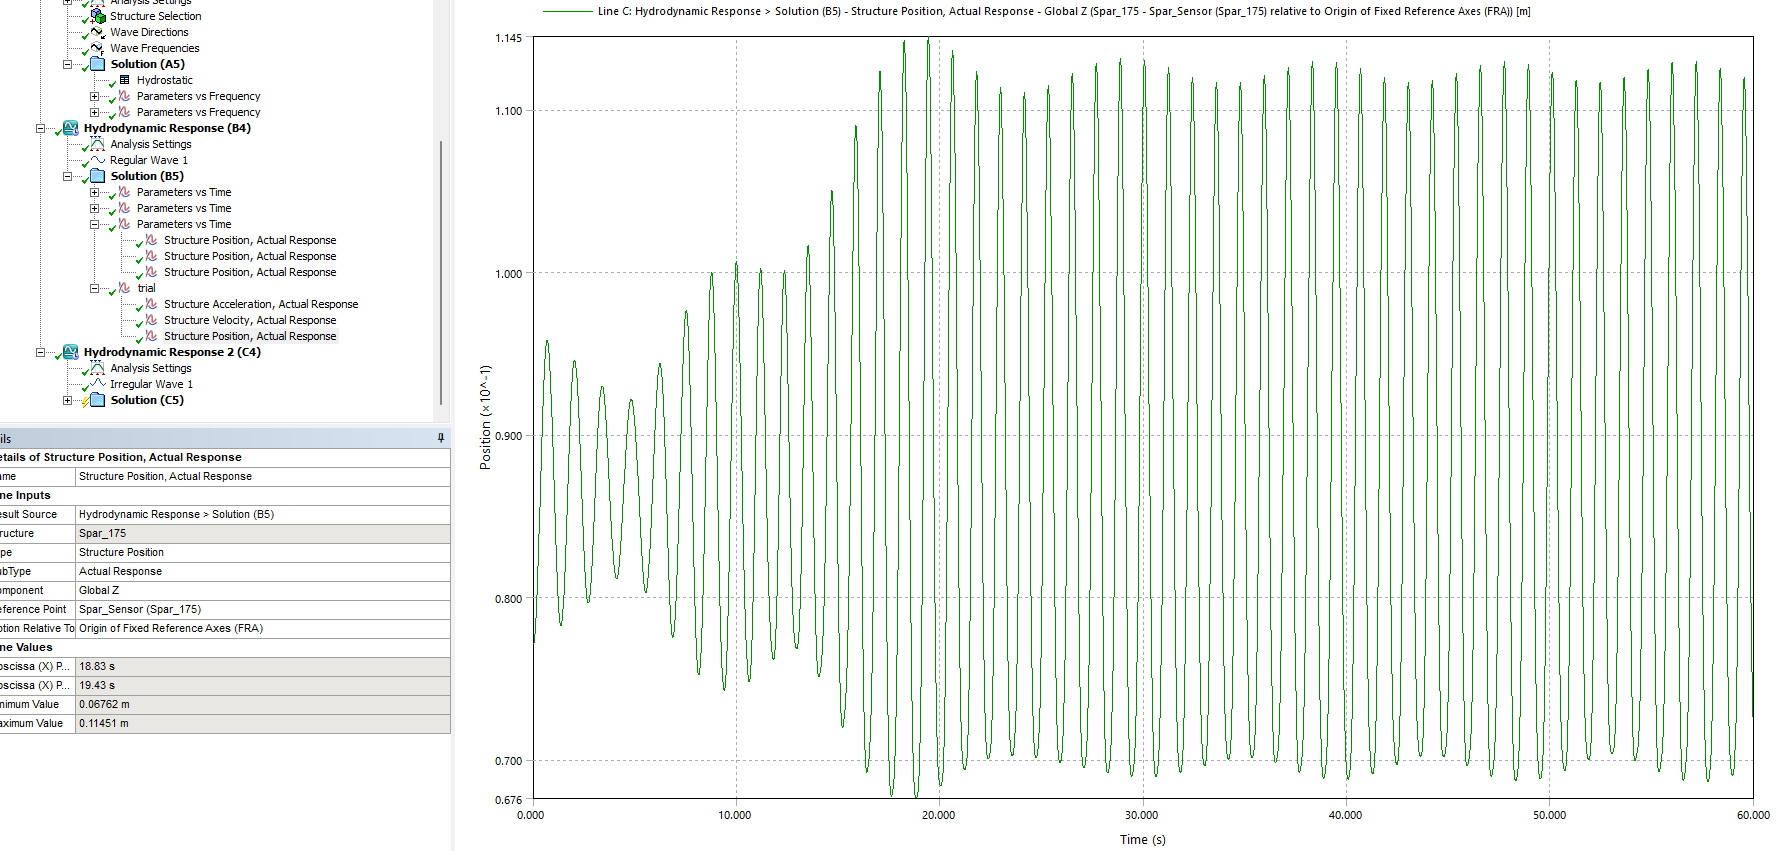
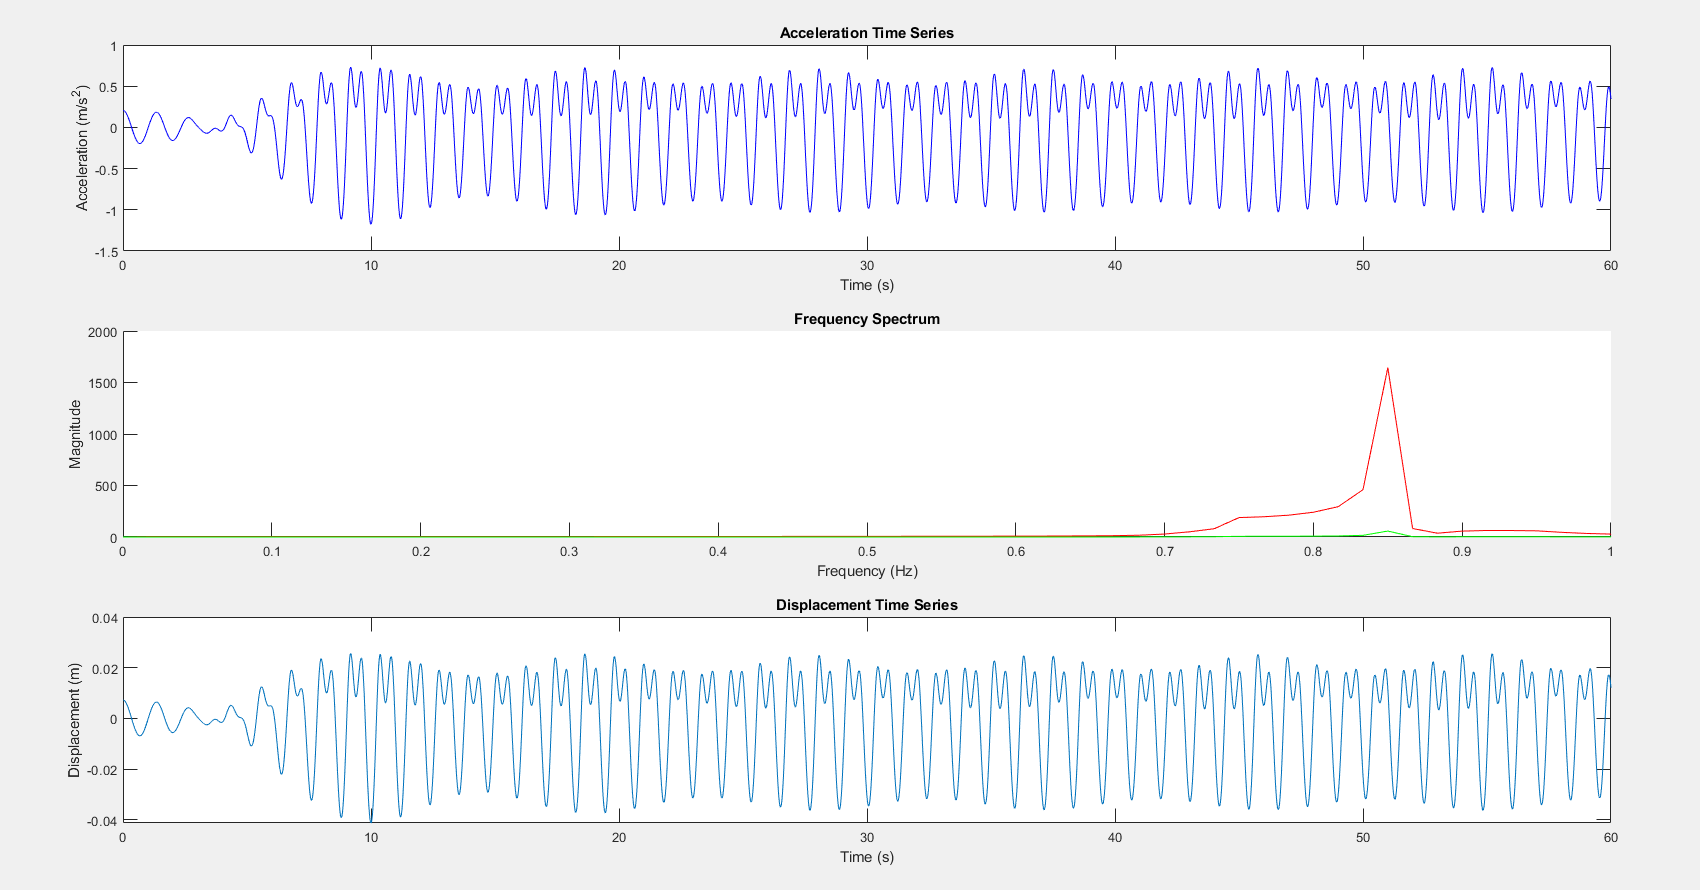
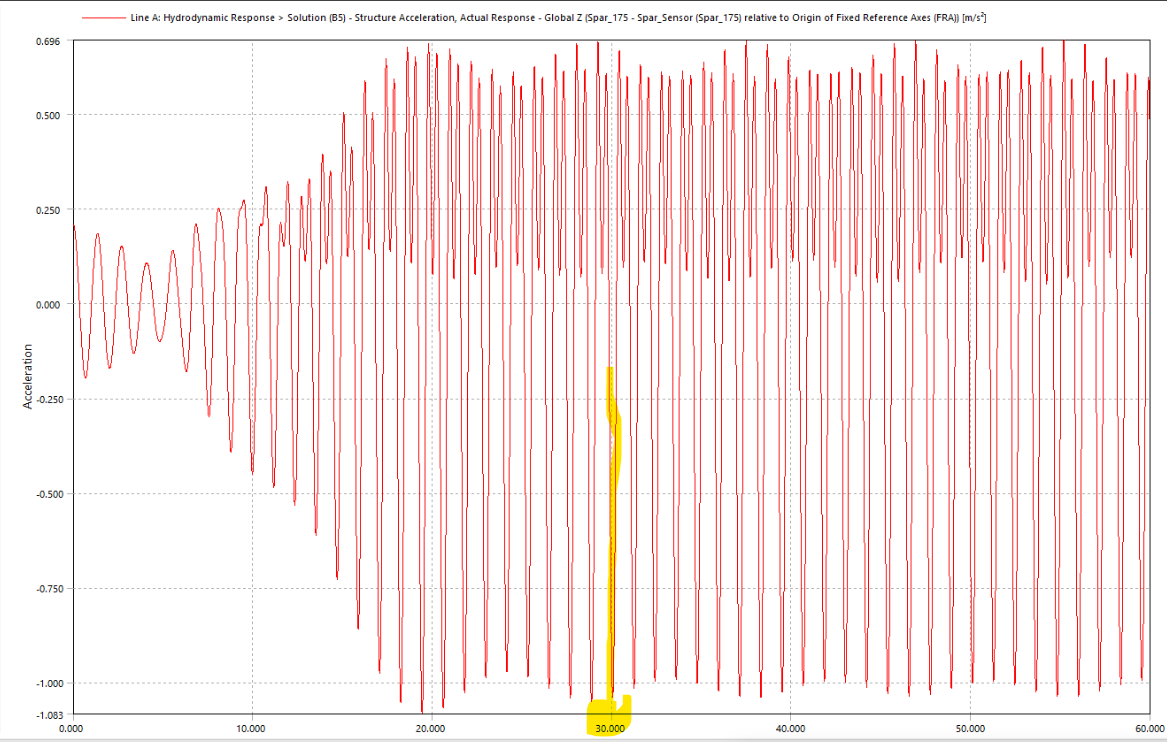
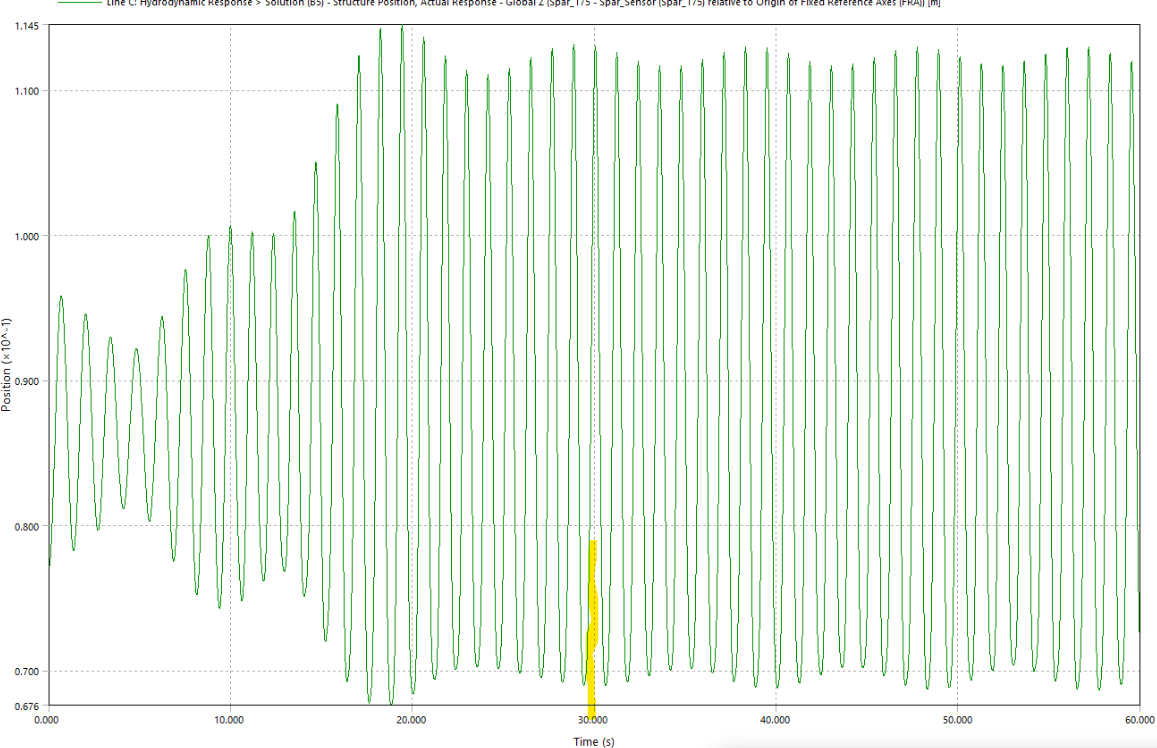
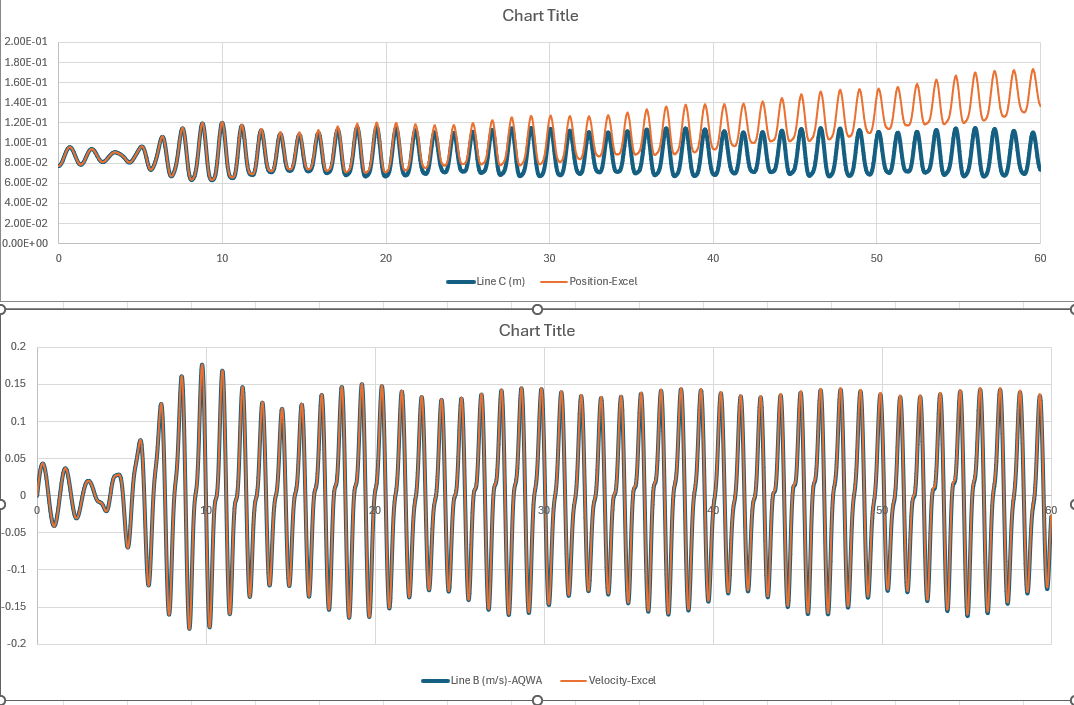
      Dear Sir, If you observe the acceleration and position curves of the time series in AQWA, you’ll notice that the position is essentially the second integral of acceleration, and as expected, the sign reverses (crest and trough issue).

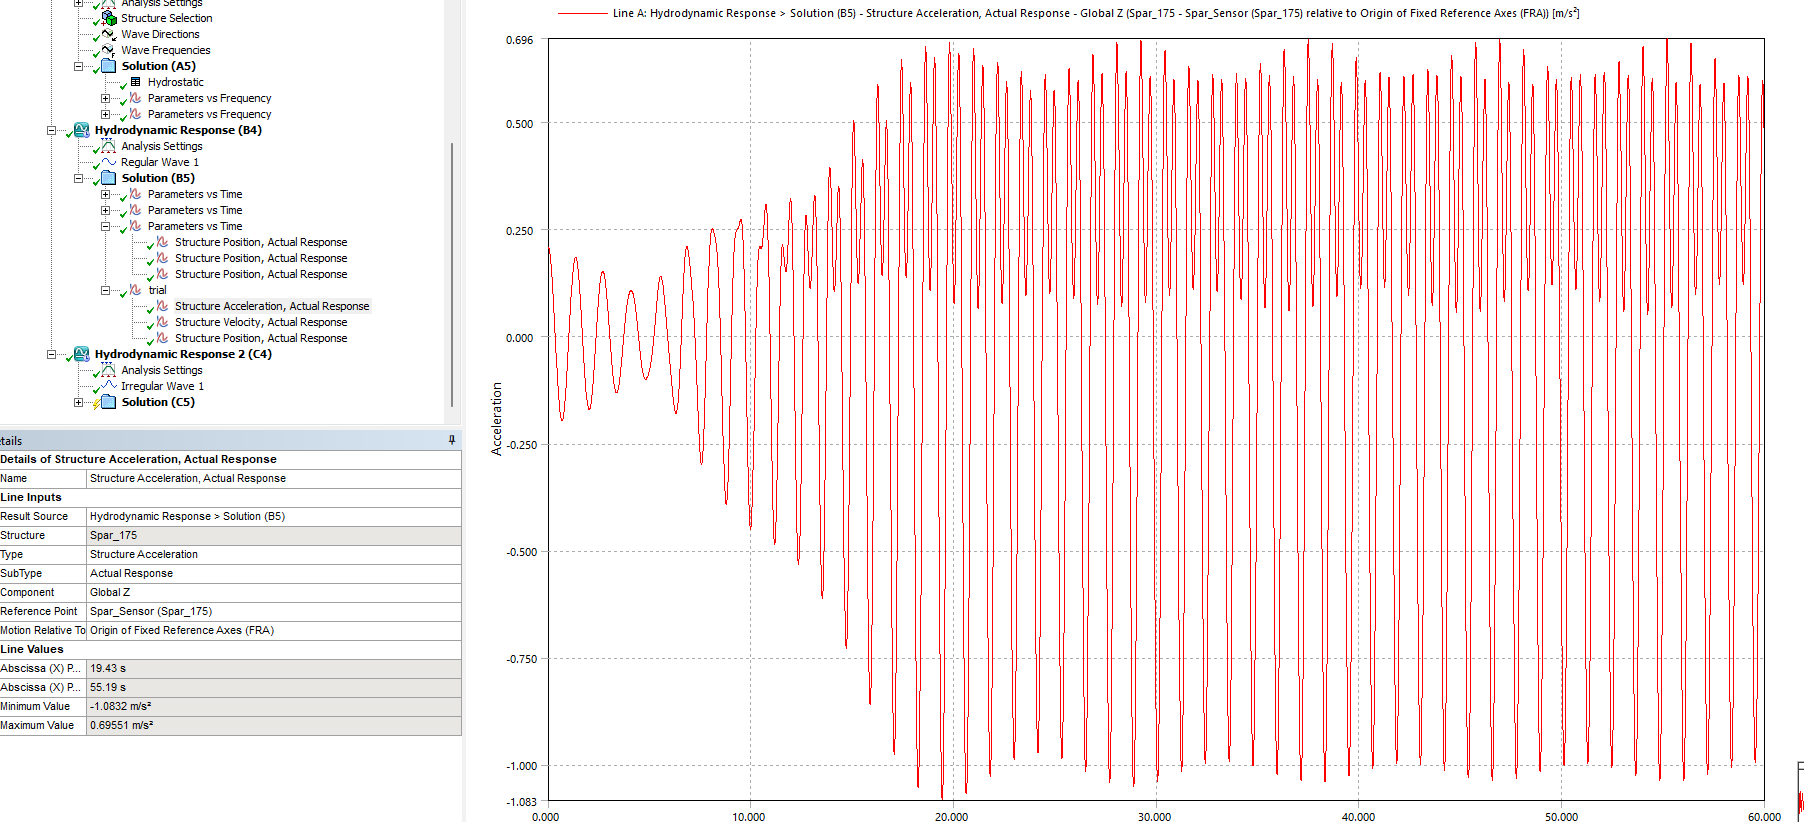
      I am completely happy and satisfied with the acceleration results — they match the experimental results very well.

      However, the displacement results show an entirely different behavior. Notably, the secondary peaks are missing. This discrepancy is the reason I raised the query.

      If you feel it would be helpful, I am happy to share relevant screenshots from the simulation to support the discussion (initial position) . I kindly feel that the current responses are not directly addressing my query and instead seem to be circling around the issue or I am not understanding them better. 

    • Shuangxing Du
      Ansys Employee

      Can you please do what I suggested first? Then we can discuss the possible reasons on the differences between the numerical and experimental positions data.

    • NVN NAMMA
      Subscriber

      The velocity and position are calculated maintaining the initial velocity and position values from AQWA results and plotted with aqwa generated results. 


      • NVN NAMMA
        Subscriber

        This is the integration results. That is good match with velocity. Displacement plot is deviating. My time step is 0.01. Could you help me where can we set the initial position. I could find only two options there

    • Shuangxing Du
      Ansys Employee

      Can you please do what I suggested? Without those results, I cannot find out where the differences come from.

    • NVN NAMMA
      Subscriber


      I believe this is in line with what you had suggested — I calculated velocity and position from the acceleration time series. Would you prefer that I do the reverse instead? When I attempted to derive velocity and acceleration from the position time series using the central difference method, the results were significantly amplified and did not yield satisfactory outcomes and far different from the aqwa results.


      https://innovationspace.ansys.com/forum/forums/topic/aqwa-actual-and-rao-based-acceleration-and-response/


    • Shuangxing Du
      Ansys Employee

      Is your time step increment small enough? If not, can you please rerun your project with smaller time step interval, which may give you better numerical derivative results, i.e. position (aqwa) -> velocity; velocity (aqwa) -> acceleration.

      I am not sure you can have accurate integration results. Please see 13.9. Integration in Time of Motion Equation, the integrations from acceleration are not so easy and straight forwards.


      • NVN NAMMA
        Subscriber

        This part is completely understood. I might be wrong with my experimental calculations. If you could help with setting the initial position that would be of great help. Also Who to model freely suspended pipes in aqwa. I modelled as a free flooded pipe. the geometry is created as a line then made as a tube element


    • Shuangxing Du
      Ansys Employee

      In Aqwa Workbench (or say, Aqwa Editor), you may not be able directly to set up the initial position and initial velocity, however they can be defined in Aqwa solver input data file, which file is automatically generated by Aqwa Workbench when running Hydrodynamic Response and stored in (your Workbench project)\dp0\AQW-1\AQW\AQ\Analysis\TimeResponse.dat.

      Please see 22.1. General Description for the input data format.  

      If you want to set these data under Aqwa Workbench, you could use a python script from External Operation before Solving to add in the initial position and velocity into the input data file of  TimeResponse.dat.  Please see 5.10.1. Specifying External Pre- or Post-Solve Operations

      Using SpaceClaim or Discovery to define the pipes, then Aqwa Editor will treat them as the line bodies and the tube elements will be automatically generated through Mesh in Aqwa Editor.


      • NVN NAMMA
        Subscriber


        Thank you for your response. I have one final query. While running a time domain analysis with a single diffracting structure, the options shown for initial positions were “based on geometry” and “program controlled.” However, when I ran the analysis with both a diffracting structure and a line element (i.e., two structures), the available options were “based on articulated position” and “program controlled.”

        Could you please clarify the difference between these four options:

        1. Initial position based on geometry

        2. Program controlled

        3. Initial position based on articulated position

        4. Program controlled (in case of multiple structures)

        If I have several test cases for the hydrodynamic time response, which option (initial position)would be appropriate? 

    • Shuangxing Du
      Ansys Employee

      Please see 5.11.4. Starting Conditions.

      1. Initial position based on geometry

             the positions in the hydrodynamic diffraction analysis will be used 

         2. Program controlled

             The equilibirum positions from the upstream stability analysis in Hydrodynamic Response may be used

         3. Initial position based on articulated position

             For multiple structure with joints, the program will automatically calculate the structures' positions to make sure the constraint conditions due to joints to be satisfied.

         4.Program controlled (in case of multiple structures)

            Program automatically finds the proper initial conditions either from equilibrium positions (stability analysis in Hydrodynamic Response) or the positions satisfying the constraint conditions if exist.

Viewing 18 reply threads
  • You must be logged in to reply to this topic.
[bingo_chatbox]