TAGGED: ansys-twin-builder, frequency-analysis
-
-
January 30, 2021 at 4:43 pm
yannick25
SubscriberHello,
currently I have to create a bode plot of a system and I am getting weird results.
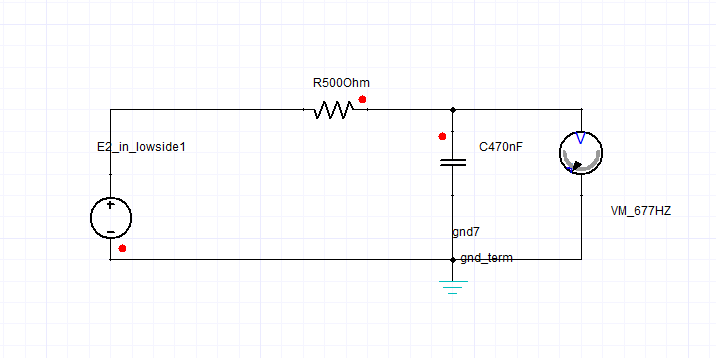
Thats why I created a simple schematic of a lowpass (corner frequency = 477Hz, with R= 500Ohm and 470nF). The result is not as expected and I don't know where my mistake may be.
In the attachement is the schematic and the plot.
Thanks in advanced !
Best regards,
Yannick
February 9, 2021 at 1:57 pmrmagargl
Ansys EmployeeI might suggest making a new plot, as that plot doesn't show the base quantity in the legend and your Gain plot is showing units of Volts on top of dB. nWhen defining the Bode Plot: Choose -E2_in_lowside1.V as your base and VM_677Hz.V as the main quantity.nAlso, when defining the AC solution over a large frequency range, under Analysis -> AC, set the sweep type to decadic and set a reasonable number of simulations points per decade.nFinally, you might want to check the values of your resistor and capacitor. It appears the values are defined in the name, to be safe, just confirm the same values are present in the component parameters. You can make just the value also visible on the schematic.nViewing 1 reply thread- The topic ‘Ansys Twinbuilder Bode plot’ is closed to new replies.
Ansys Innovation SpaceTrending discussionsTop Contributors-
3472
-
1057
-
1051
-
934
-
902
Top Rated Tags© 2025 Copyright ANSYS, Inc. All rights reserved.
Ansys does not support the usage of unauthorized Ansys software. Please visit www.ansys.com to obtain an official distribution.
-
The Ansys Learning Forum is a public forum. You are prohibited from providing (i) information that is confidential to You, your employer, or any third party, (ii) Personal Data or individually identifiable health information, (iii) any information that is U.S. Government Classified, Controlled Unclassified Information, International Traffic in Arms Regulators (ITAR) or Export Administration Regulators (EAR) controlled or otherwise have been determined by the United States Government or by a foreign government to require protection against unauthorized disclosure for reasons of national security, or (iv) topics or information restricted by the People's Republic of China data protection and privacy laws.


