-
-
October 17, 2018 at 2:49 pm
Bibek Poudel
SubscriberHi,Â
I am doing transient simulation in Fluent. I initialized the solution at first and did the simulation to 1 second where I tracked my particles for each timesteps. And then I continued my calculation to 2 seconds and then when I tried to see my particle track results, it is only showing from 0.5 second to 1.5 second. I cannot update my minimum and maximum time for tracking. There is the option for updating the minimum and maximum time; but I can't make any changes to that. It seems like that option has already been fixed. I want to see my particle tracking results from whole 0 second to 2 seconds, why is it not showing? What can I do to view the results for whole 2 seconds?Â
Thank you for your time in advance!!
Bibek -
October 17, 2018 at 3:39 pm
Rob
Forum ModeratorPlease provide screen shots.
-
October 17, 2018 at 3:56 pm
-
October 18, 2018 at 3:46 am
Karthik Remella
AdministratorHello Have you attempted to disable ‘Auto Range’ in the above screenshot and modified your Min’ and ‘Max’ values?
Thanks.
Best Karthik -
October 18, 2018 at 4:49 pm
Bibek Poudel
SubscriberKremella, Thanks dude.It was stupid of me to not try that.Â
-
October 18, 2018 at 4:59 pm
Karthik Remella
AdministratorHello,
You're welcome! Did this resolve your issue?
Best,
Karthik
-
October 18, 2018 at 7:12 pm
-
October 18, 2018 at 7:21 pm
Karthik Remella
AdministratorHi,
Sure, glad to have helped.
If you don't mind, could you please mark the most relevant answer as 'Is Solution'? This would help someone find the solution immediately if they had a similar question. Here are some Guidelines for posting on the student community (for future reference).
Good luck with your modeling.
Thank you.
Best Regards,
Karthik
-
October 18, 2018 at 8:53 pm
Bibek Poudel
SubscriberHi,Â
Sure. I just marked your answer as 'Is solution'.Â
Thanks! -
October 19, 2018 at 3:29 pm
Bibek Poudel
SubscriberHi Karthik,Â
Sorry to bother you again, but I am again having some issues. I was able to view the results from time 0 to final second, thanks to you. But, whenever I tried to view the results within certain timeframe, it shows me the same result. And still I don't think I am getting the previous set of result. I feel like I can't access to the result of the previous timeframe. I have attached you some pics of my result: :
Â
Â
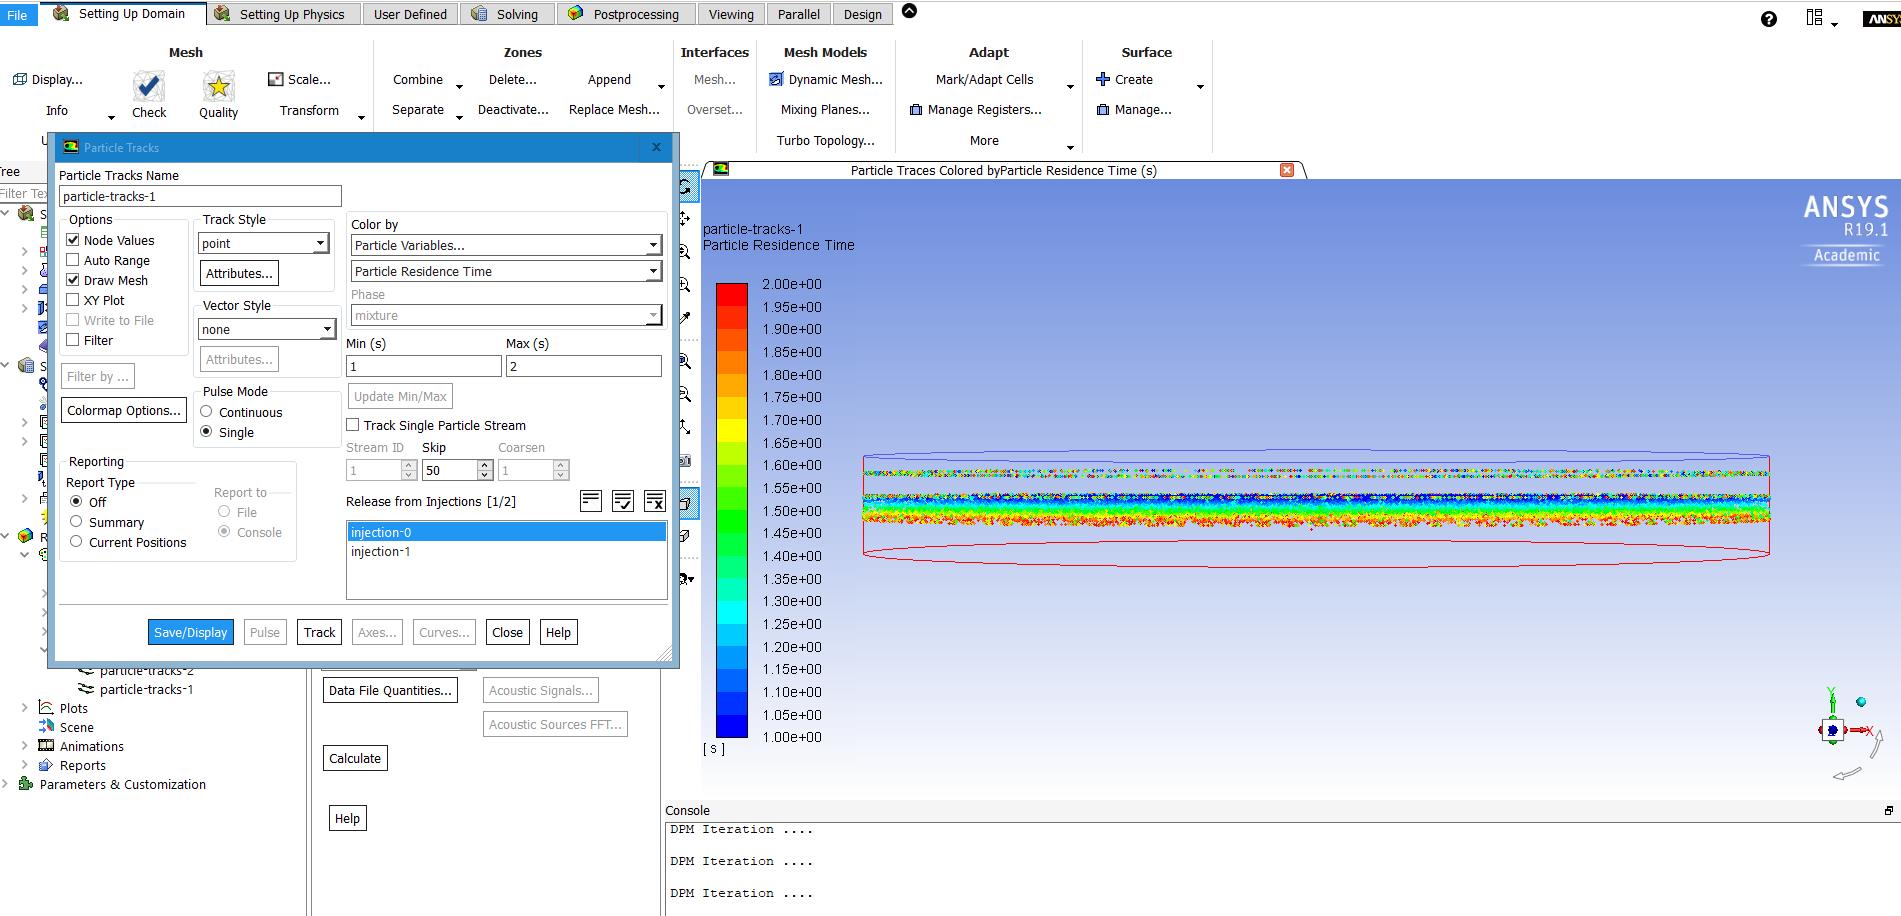
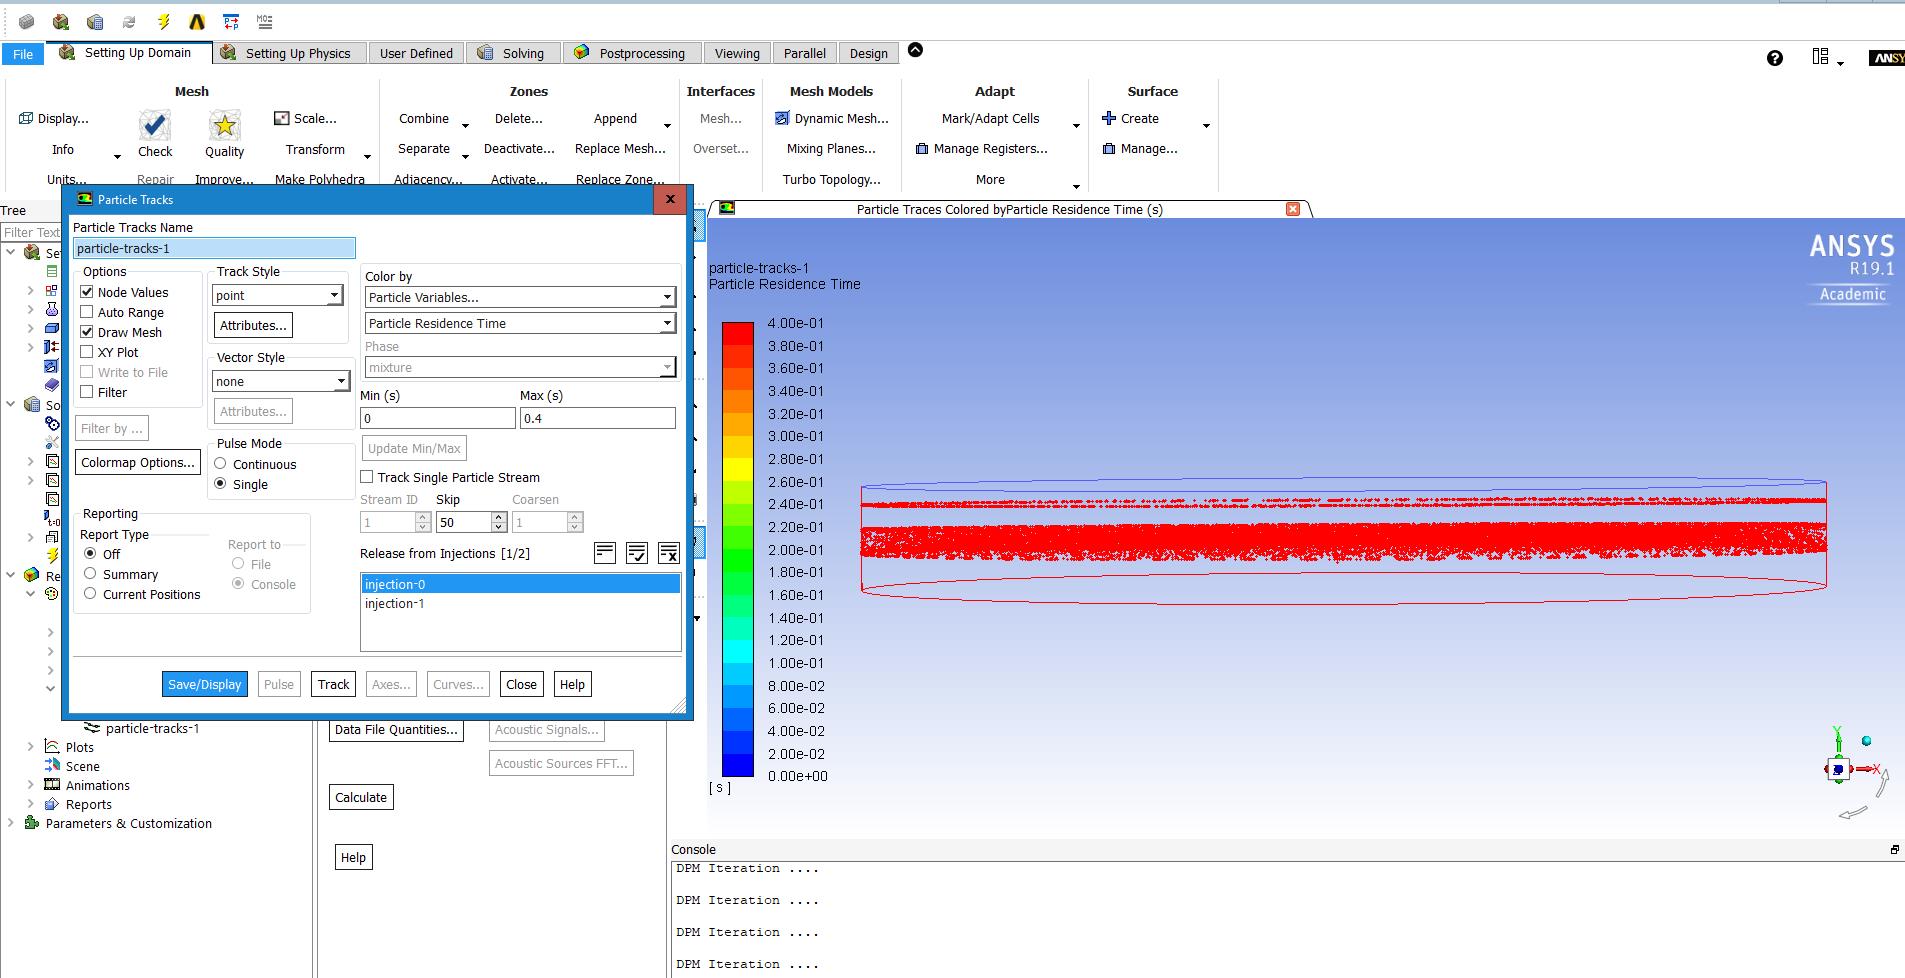
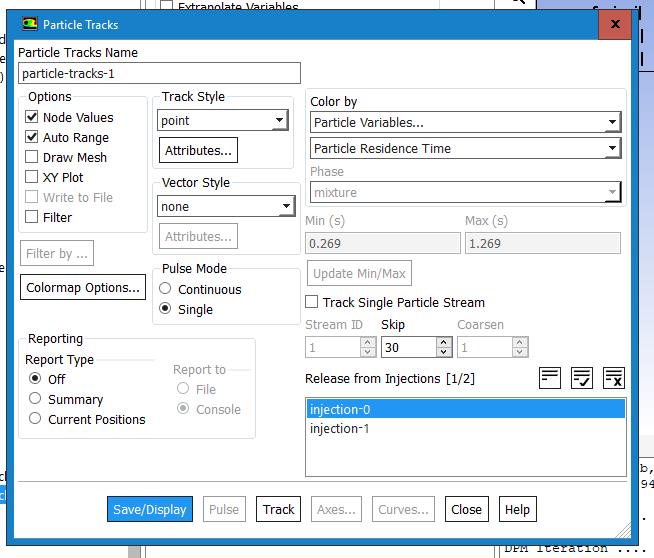
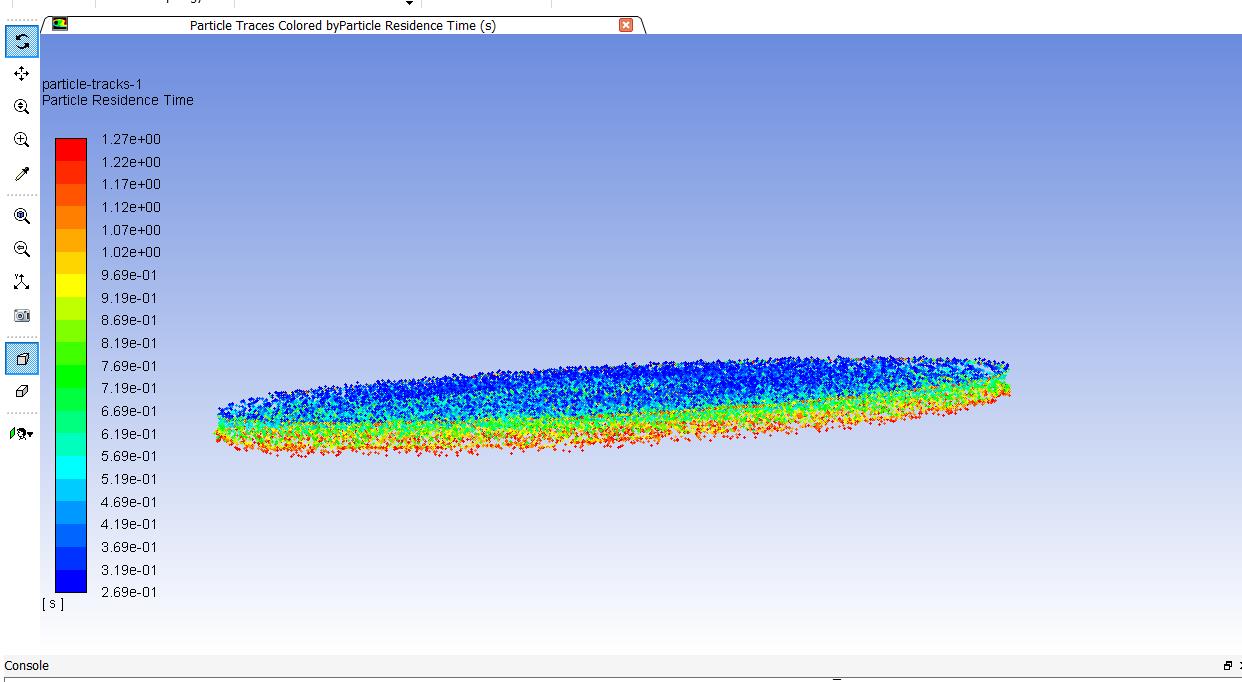
You see here I tried to track the particles first from 1 to 2 seconds and then from 0 to 0.4 seconds. It is kind of showing me the same profile with different colors. I am not getting the exact results for the particle track from 0 to 0.4 seconds, I believe. So, can you please tell me is there something I am doing wrong??Â
Thank you for your help,Â
Bibek! -
October 19, 2018 at 4:21 pm
-
October 19, 2018 at 4:26 pm
Bibek Poudel
SubscriberSorry I posted the wrong image, Here is the correct one. Sorry
Â
Here I have calculated from t=0 to t=2 second. But when trying to filter the results, it shows that ih has been calculated as only from t=1 to t=2 s. It won't allow me to change the minimum value; it is behaving like I have only calculated from t=1 to t=2. Why is that so?? Can you please help me.Â
Thanks,Â
Bibek -
October 19, 2018 at 4:55 pm
Karthik Remella
AdministratorHello,
When you are plotting particle tracks and color by Particle Residence Time variable, Fluent is using the plotting the particle position (at the end of a certain simulated time - based on your current data file) and coloring these particles based on a variable Particle Residence Time. This variable is generally defined as the time spent by a particle inside the computational domain and based on the type of problem you are solving, you will have a certain minimum and maximum value. It only makes sense to change the scales with in the minimum and maximum range for these values.
I think you are confusing this with the position of the particles at a particular time (or timestep) during your flow simulation. In order to get this, you will have to write out the data file at those exact time-steps. Once you have all the data files for your various time steps, you can read these data files one by one into Fluent to understand how your particles are moving in time. You can use the AutoSave menu under Calculation Activities to facilitate writing the data files at certain intervals. Please see the screenshot below.
I hope this helps.
Best Regards,
Karthik
-
October 22, 2018 at 2:43 pm
Bibek Poudel
SubscriberHi Karthik,Â
Thank you so much for your reply. And yes, I was thinking that was the absolute position of the particle at that particular time. That was my huge mistake then. Now, I have used autosave after each timestep and run the calculation. So now, how can I read those data files??Â
Thank you for the clarification,Â
Bibek -
October 22, 2018 at 2:53 pm
Karthik Remella
AdministratorHello,
You can read the data file from File -> Read -> Data and create your 'Particle-Tracks' for each data set. Before reading the data, please make sure to read your case file first.
If you are trying to automatically extract and save the particle-tracks as an image file as Fluent is running the simulation, you can use 'Execute Commands'. You can choose your interval and use certain TUI commands to do this. Please refer to the Fluent Customization Manual for instructions on how to use TUI commands to do this, If you are interested.
I hope this helps.
Best Regards,
Karthik
-
October 22, 2018 at 9:23 pm
-
October 23, 2018 at 12:47 am
Karthik Remella
AdministratorHello,
You are seeing this issue because you are working in the WorkBench environment. I had taken the screenshot as a standalone Fluent run. WorkBench has its own file management system in place and therefore you are not seeing the option of loading additional data files. You should see additional options to load data files in WorkBench environment using the 'Import' option. Please see the following screenshot.
I hope this helps.
Best Regards,
Karthik
-
- The topic ‘ANSYS Fluent Transient Simulation’ is closed to new replies.
- How do I get my hands on Ansys Rocky DEM
- Unburnt Hydrocarbons contour in ANSYS FORTE for sector mesh
- Help: About the expression of turbulent viscosity in Realizable k-e model
- Script Error
- Facing trouble regarding setting up boundary conditions for SOEC Modeling
- convergence issue for transonic flow
- Running ANSYS Fluent on a HPC Cluster
- Point exception in erosion calculation
- Errors with multi-connected bodies using AQWA
-
1997
-
897
-
599
-
591
-
444
© 2025 Copyright ANSYS, Inc. All rights reserved.