-
-
November 12, 2024 at 9:13 am
S.S.S.ShankaVasuki
SubscriberHi,
I am trying to working with multi-connected floating bodies in AQWA. I have validated my results with a reference article through the RAOs from the frequency statistical analysis and they have a good match.
But now I want to know the actual/realtime system response in the time domain over a long duration of time (say for a period of 1 year)
In this case, I believe running the hydrodynamic response analysis (time domain) for a duration of 1 year in the steps of 0.1s would take a loooong time and I dont think it is practical.
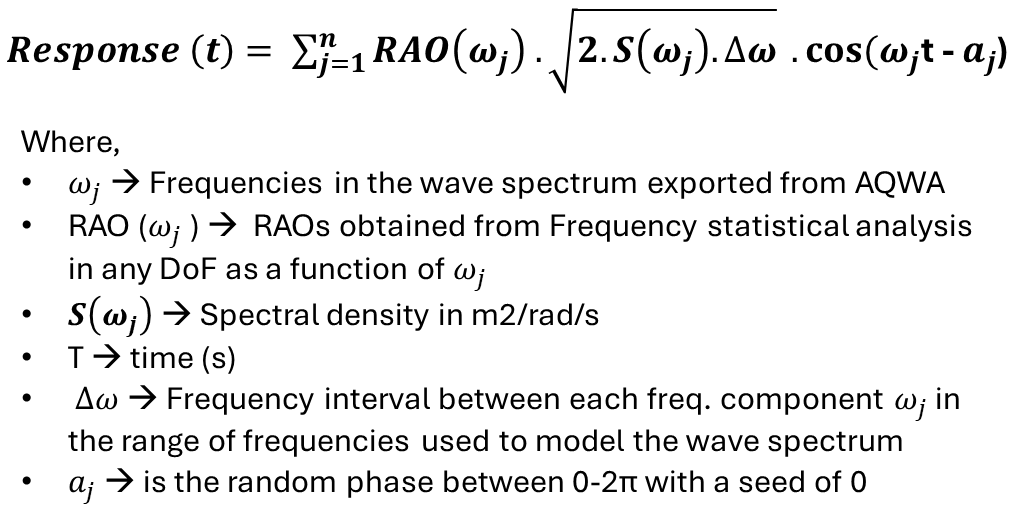
Hence, I wanted to know if there is any simpler ways of doing this by using the RAOs. I did read through the AQWA theory manual and I tried using this equation to obtain the actual response from the RAOs as shown below:
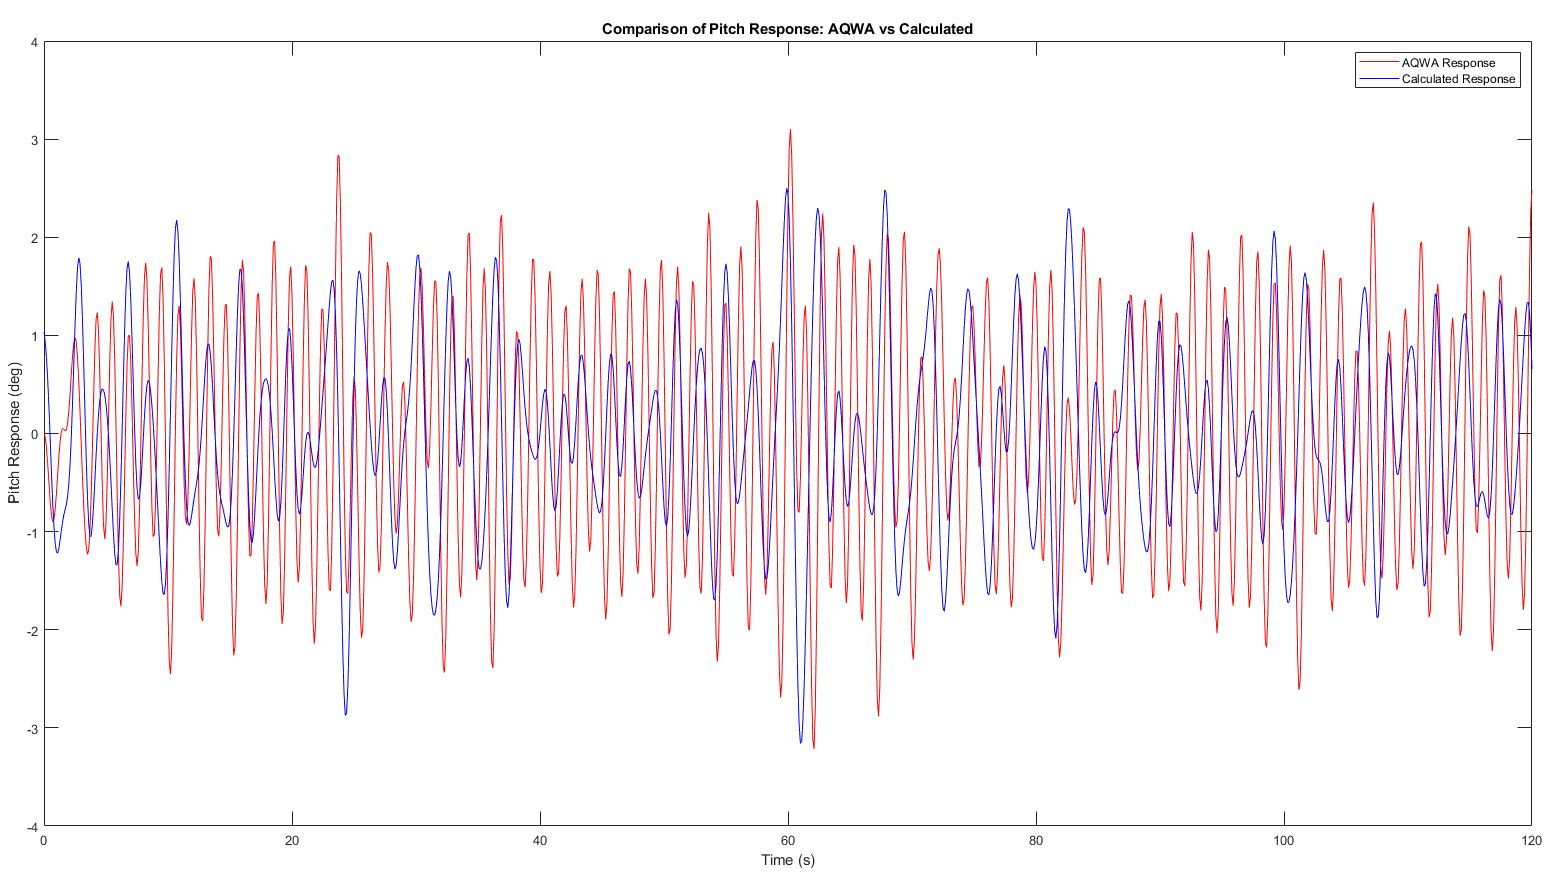
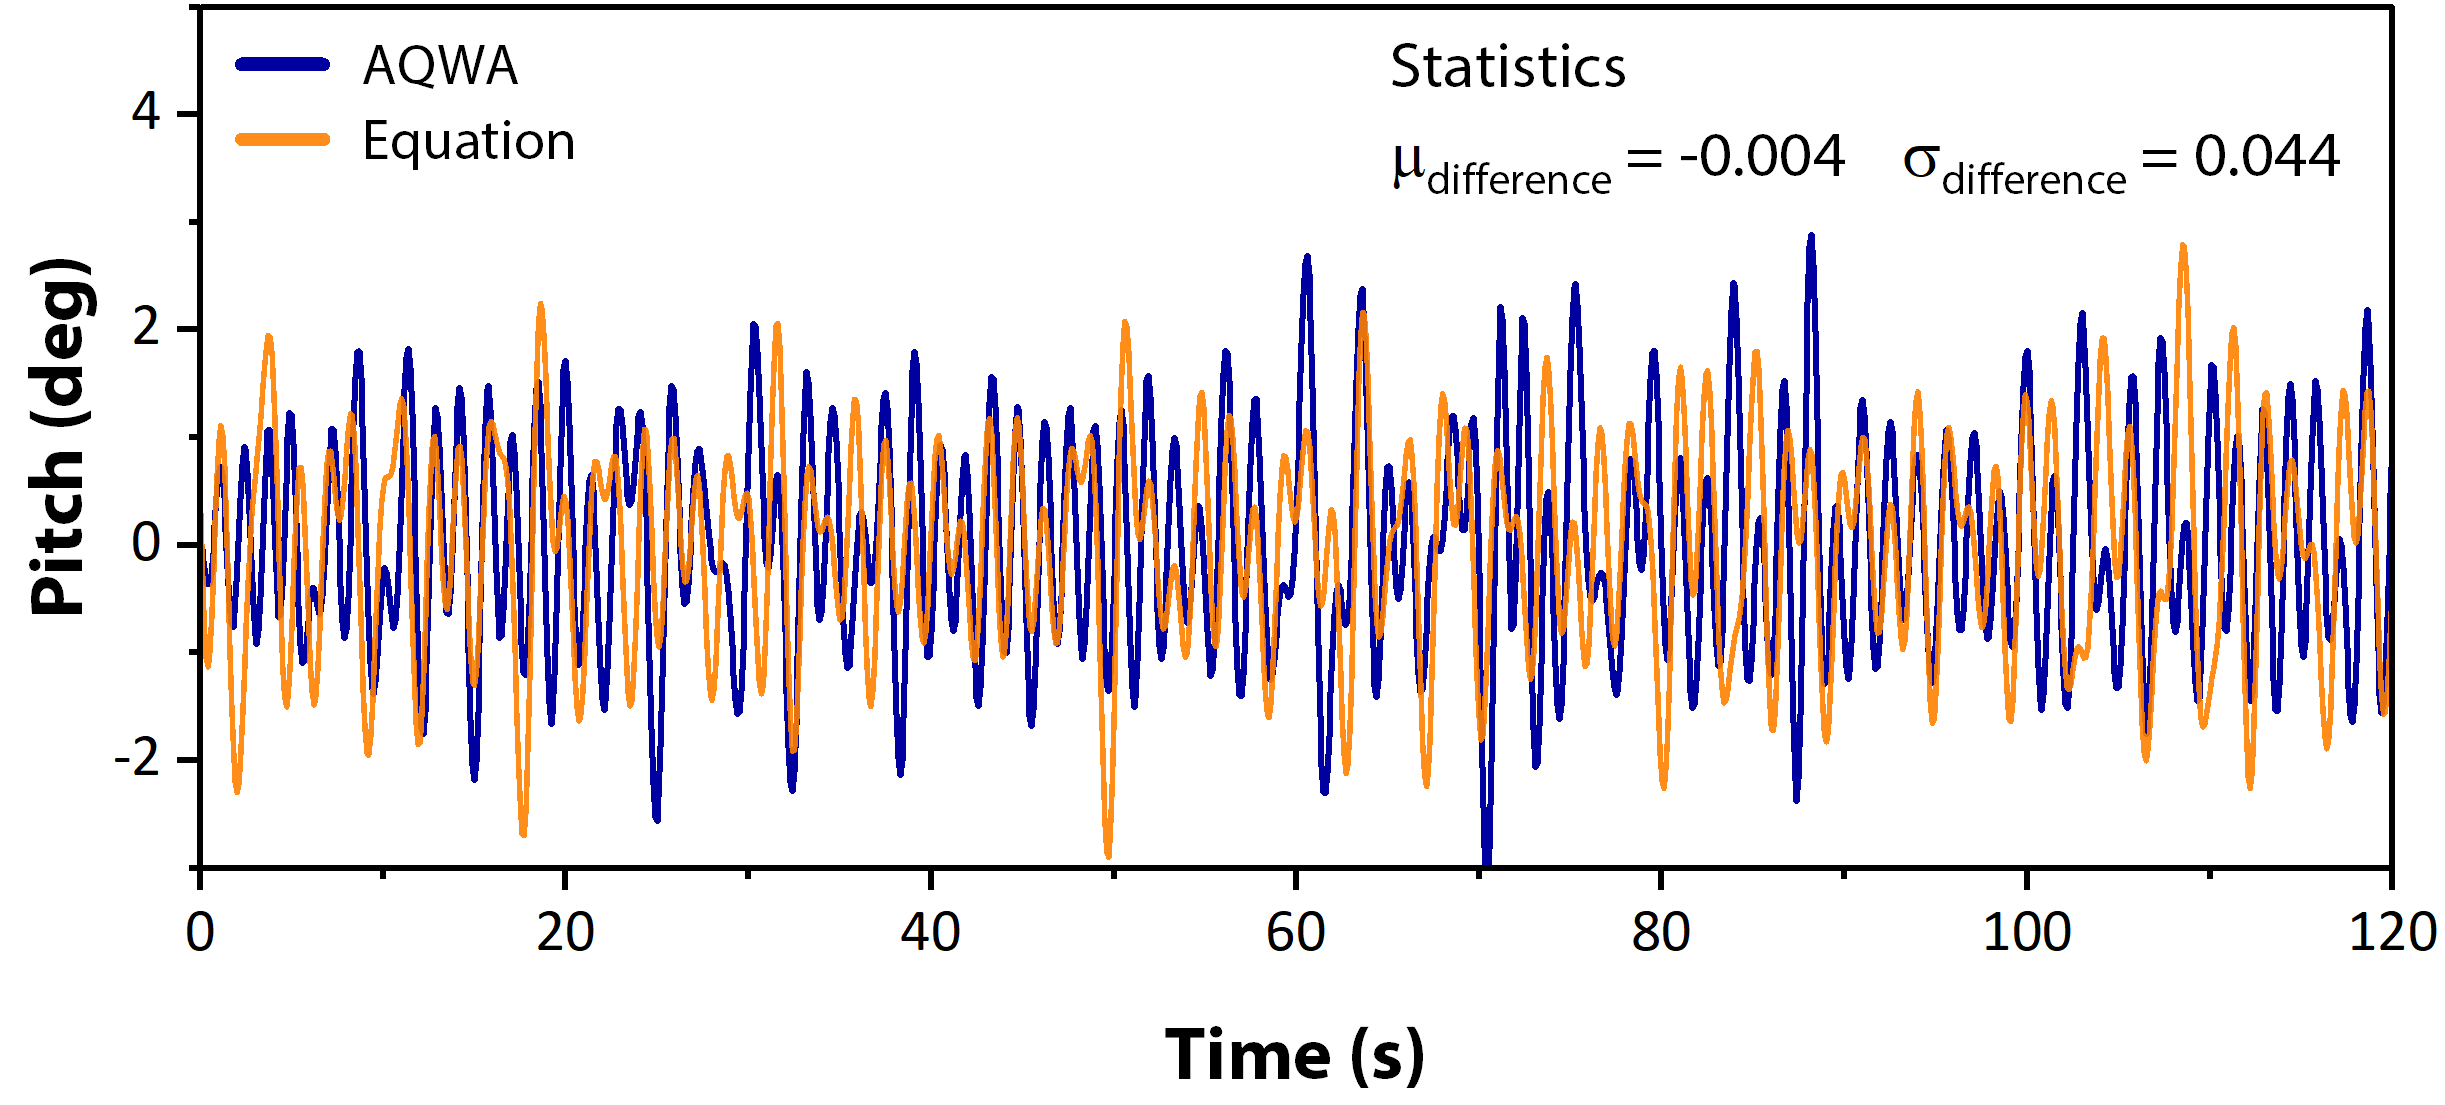
But the problem with this correlation is I do not get the exact match with the actual response from the time domain analysis. I understand that there might be a mismatch between the value of the phase aj in the above equation, but I also specified a seed value of 0 in aqwa but still end up getting a different response curve as shown below. But an the time domain statistics of mean and standard deviation difference between the one obtained from AQWA and the equation is quite low which technically says that they are the same. But, i would want to get the same response as the results from the time domain analysis. So is there any way to get long term response from RAOs??
-
November 15, 2024 at 12:02 pm
S.S.S.ShankaVasuki
SubscriberHi,
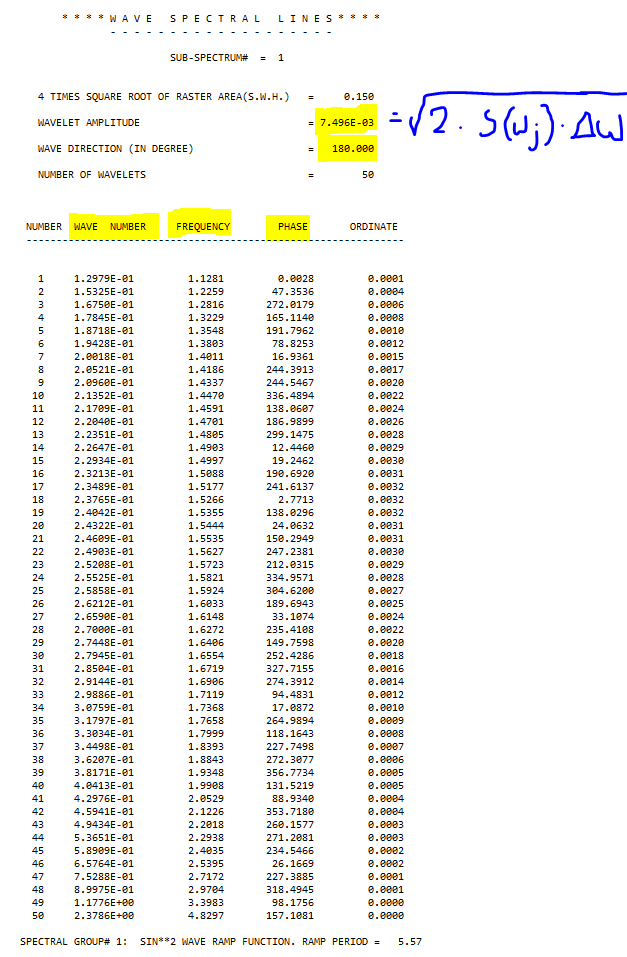
I tried the solution you mentioned. But I dont see the previous comment for some reason. This is my .LIS file from the time domain analysis and I have used the following values in the equation
In the equation I have now used --> amplitude = sqrt(2 . S(wj) . del w) = 7.496E-03 ; aj = Phase column
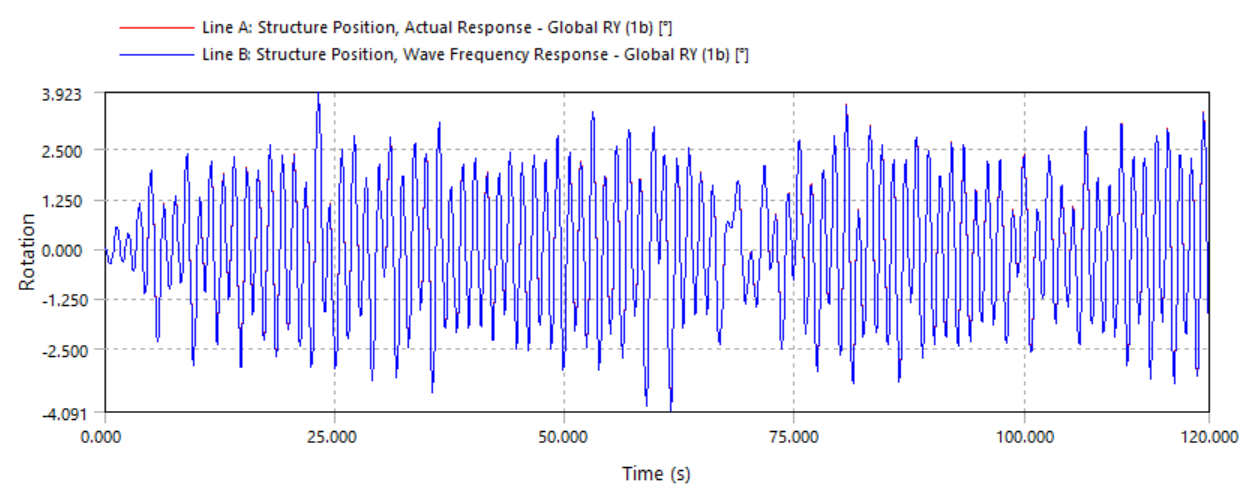
I do get a better match i guess, but its not the same. I understand that there are some non-linearities that are included in the actual responses from the time domain analysis, however I also checked the wave frequency response as shown in the figure, the response from actual response and wave frequency response are the same.
So I am not sure why this equation is not giving the right results as shown in the figure below? Is there any other method to obtain long term responses? Please help me out with this
-
- You must be logged in to reply to this topic.


-
4763
-
1565
-
1386
-
1242
-
1021

© 2026 Copyright ANSYS, Inc. All rights reserved.

