TAGGED: mechanical, transient-structural
-
-
December 27, 2022 at 3:26 pm
Hiwa Ghaffari
SubscriberHi.
I am doing a transient analysis. I want to apply an impulse force obtained from a Maxwell 2D transient analysis to the object. Figure-1 shows the diagram of force changes in terms of time (black curve). Since I have not found a way to apply this force, I have approximated it as a red curve. That is, the extremum points are connected linearly.
Importing force to the mechanical environment is done through Maxwell's direct link. 4-time steps are defined so that in each of them, the value of one of the force extremums is applied, then by ramping them, the said linear curve is obtained.
But, I could not apply a ramp with a negative slope to the force, and ramping is done only in an upward direction. Figure-2 shows the final state of the force curve, which is different from the desired one.
Can someone please guide me to fix this problem?

-
December 28, 2022 at 1:41 pm
Aniket Chavan
Forum Moderator- Are you applying this as an imported load?
- If yes, I am not sure if datapoints on graph above matches with the one in the tabular data below
-Aniket
-
December 28, 2022 at 7:26 pm
Hui Liu
Forum ModeratorCould you clarify more about the workflow? If the force is mapped directly from Maxwell to Mechanical you shouldn't need to change any setting to alter the imported load value. Does the force plot look like what you show in the first figure in Maxwell?
-
December 30, 2022 at 3:02 pm
Hiwa Ghaffari
SubscriberHi Aniket.
- Yes, I have imported the surface force density into the Transient Structural analysis and applied it to the target surface body (Electromagnetic and mechanical analysis both are in 2D mode.
- This problem exists. When the body force density is imported into the mechanical, the maximum and minimum force values are located at times that are slightly different from the extremum points of the diagram. In this problem, the maximum body force density is obtained in time 80 us, while the graph shows the first maximum point at about 90 us. I have defined the time steps as equal to the corresponding times of the maximum and minimum of the imported body force density values.
- Maybe it would be better to ask my question like this: why when the amount of force at 80 microseconds is linearly connected to its value at 205 microseconds, the slope of the line is upward, while the amount of force at 205 microseconds is lower? The slope of the line should be downward.
-
December 30, 2022 at 6:31 pm
Hiwa Ghaffari
SubscriberHi HuiLiu.
As far as I know, when force density is imported from a transient analysis in Maxwell into Mechanical, it is necessary to specify a specific time to import the force value at that time. That is, it is not possible to import force changes (in terms of time) in the entire analysis time, as the curve shows.
So, the only way I had was to approximate the graph linearly. In this way, the times related to the extremum points can be determined for importing the force density at them. Next, if the ramp can be correctly determined to load the table values in time steps, the linearized graph will be obtained.
-
- The topic ‘
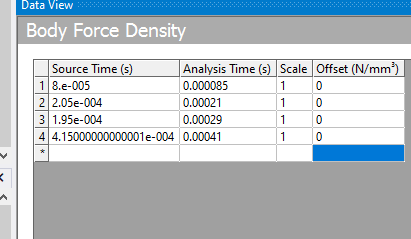
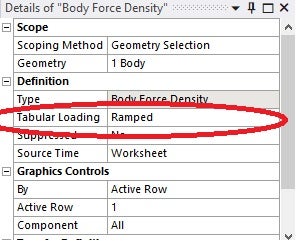
A problem in “tabular loading” of the imported body force density.’ is closed to new replies.
-
6465
-
1906
-
1458
-
1308
-
1022
© 2026 Copyright ANSYS, Inc. All rights reserved.

