Ansys Learning Forum › Forums › Discuss Simulation › Photonics › Q analysis script understanding › Reply To: Q analysis script understanding
September 26, 2023 at 2:00 am
 Devika Padmakumar Nair
Ansys Employee
Hello,
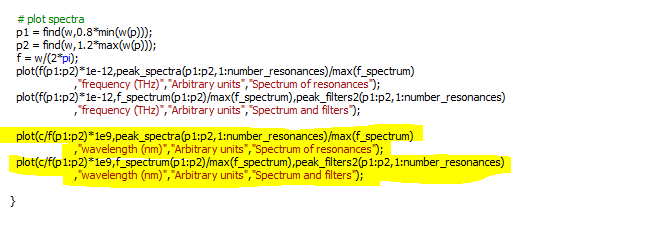
Add the following lines at end of the script. You can plot the result in wavelength.
plot(c/f(p1:p2)*1e9,peak_spectra(p1:p2,1:number_resonances)/max(f_spectrum)
,"wavelength (nm)","Arbitrary units","Spectrum of resonances");
plot(c/f(p1:p2)*1e9,f_spectrum(p1:p2)/max(f_spectrum),peak_filters2(p1:p2,1:number_resonances)
,"wavelength (nm)","Arbitrary units","Spectrum and filters");
Note: When you use Forum next time please try to share more details. The more details you write the faster you get a suggested solution.


