Ansys Assistant will be unavailable on the Learning Forum starting January 30. An upgraded version is coming soon. We apologize for any inconvenience and appreciate your patience. Stay tuned for updates.
Fluids

Fluids

Topics related to Fluent, CFX, Turbogrid and more.

AQWA-Jonswap Spectrum-Hydrodynamic time response?

    • NVN NAMMA
      Subscriber

      Hello,

      I’m working with ANSYS AQWA for time-domain response analysis. I have defined a JONSWAP spectrum to generate irregular waves and have obtained the wave elevation time series as output.

      I would like to check how well the simulated wave elevation matches the theoretical JONSWAP spectrum (for the same parameters).

      Does AQWA provide any built-in way to view or export the frequency-domain spectrum (Power Spectral Density) of the output elevation time series? If not, what is the recommended practice for verifying the agreement between the input spectrum and the generated wave time series?

      Any suggestions or workflows for this verification would be much appreciated.

      Thank you!

    • Shuangxing Du
      Ansys Employee

      Yes, you can use Ags to do it.

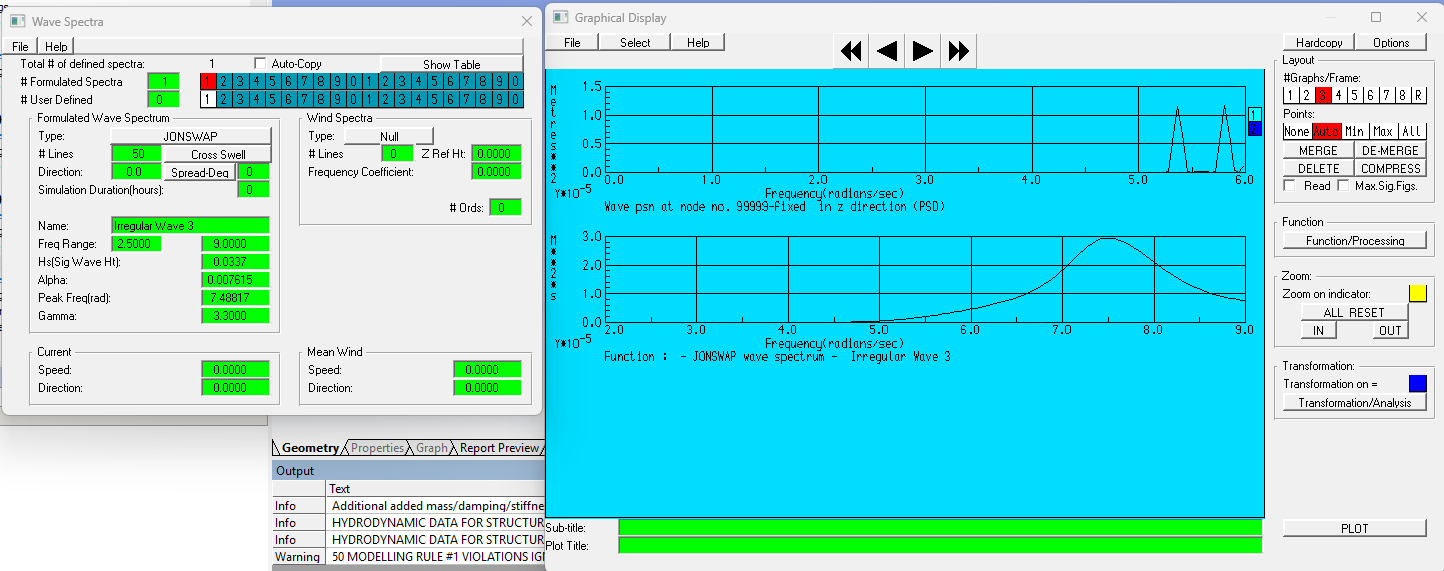
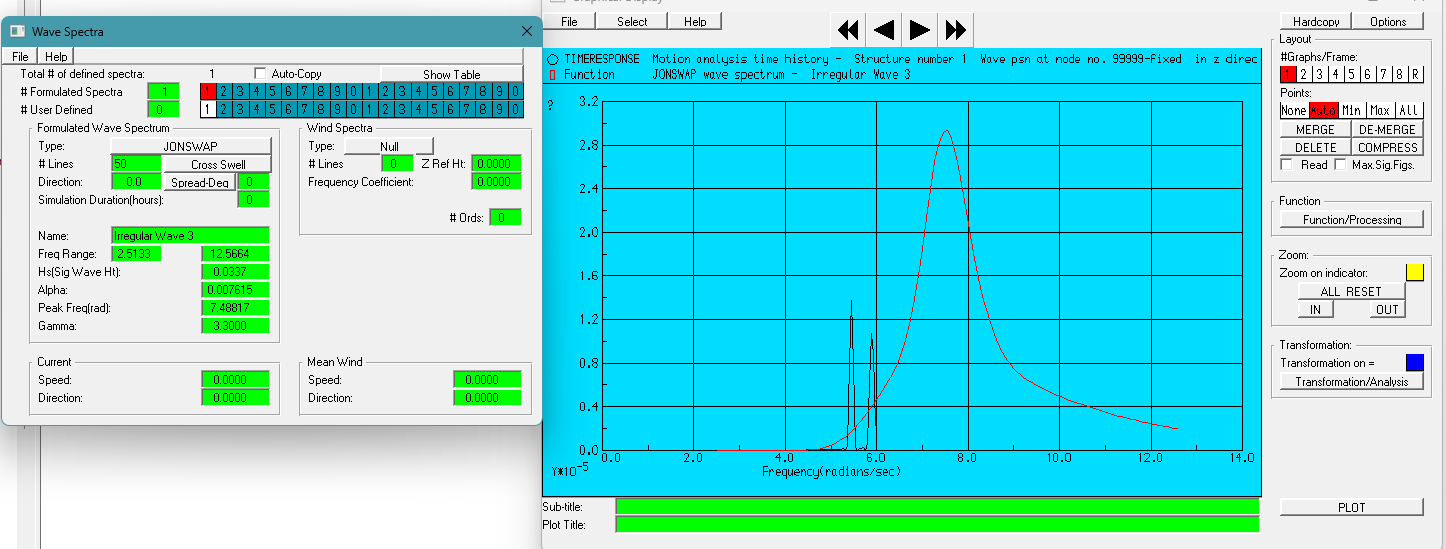
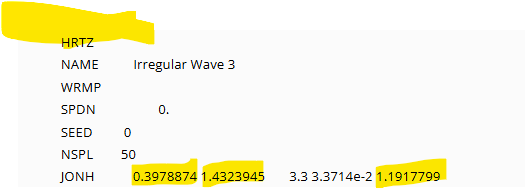
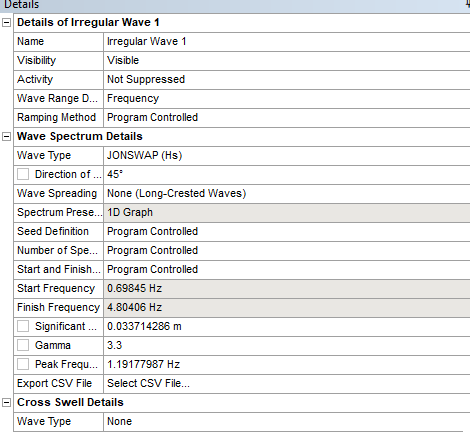
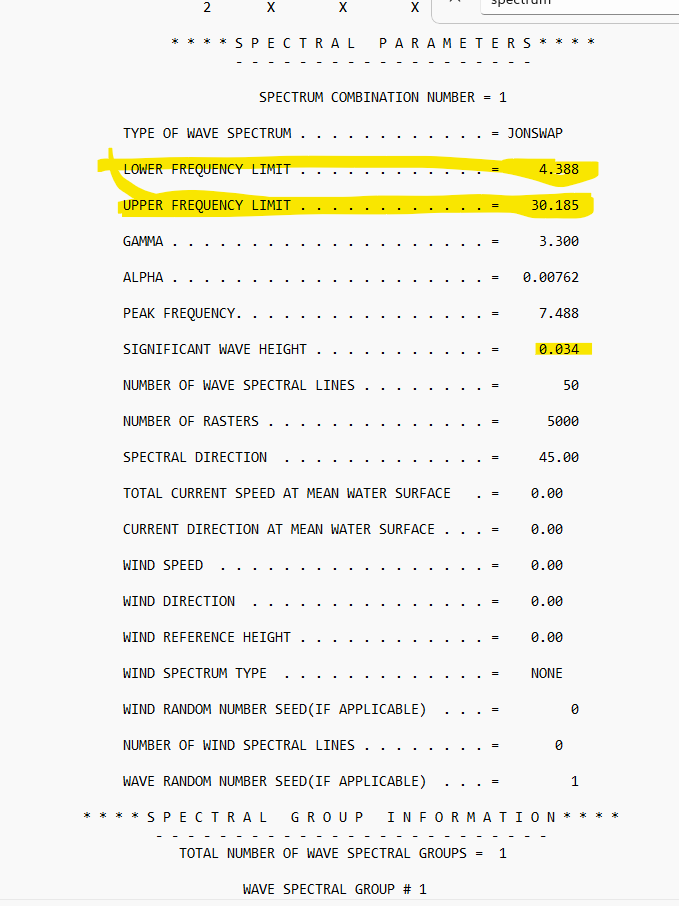
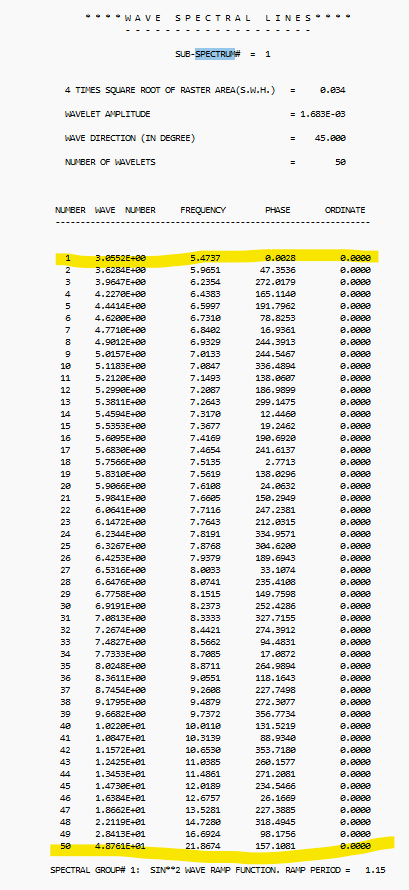
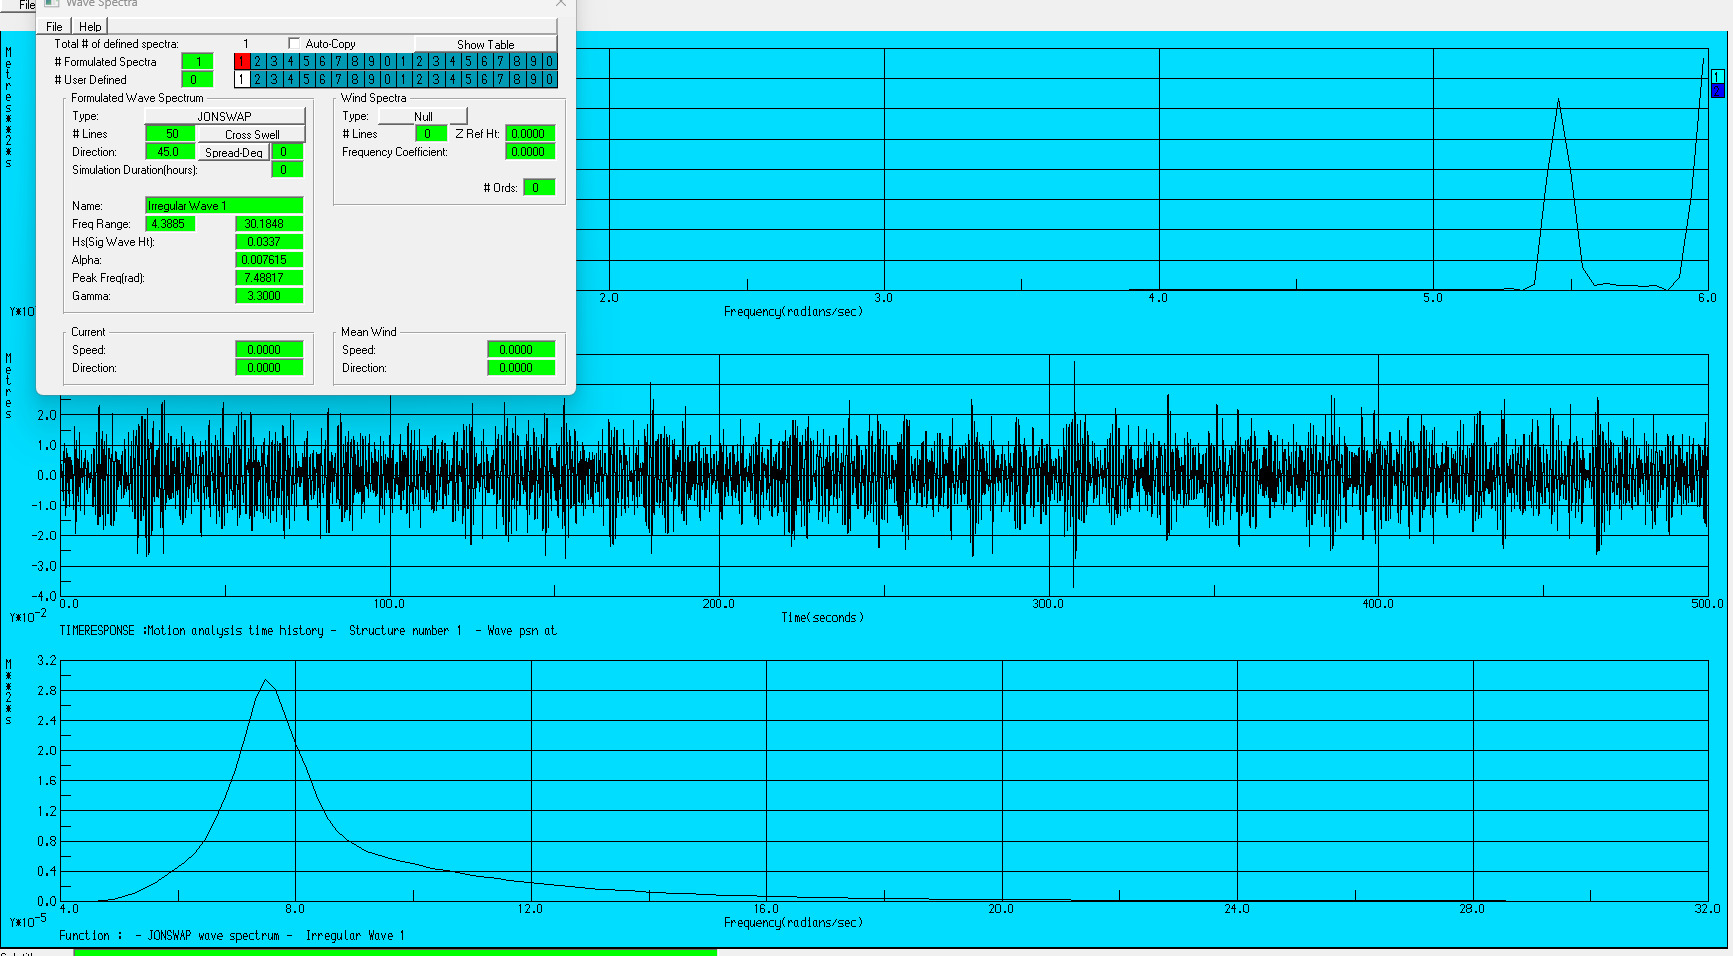
      (1) Run Hydrodynamic time domain analysis with JONSWAP wave spectrum and make sure the time step is small, for example 0.1 second, and the duration is long enough, such as 500 seconds.

      (2) The results are stored in (Your project)\dp0\AQW-?\AQW\AQ\Analysis\TIMERESPONSE.RES and TIMERESPONSE.PLT.

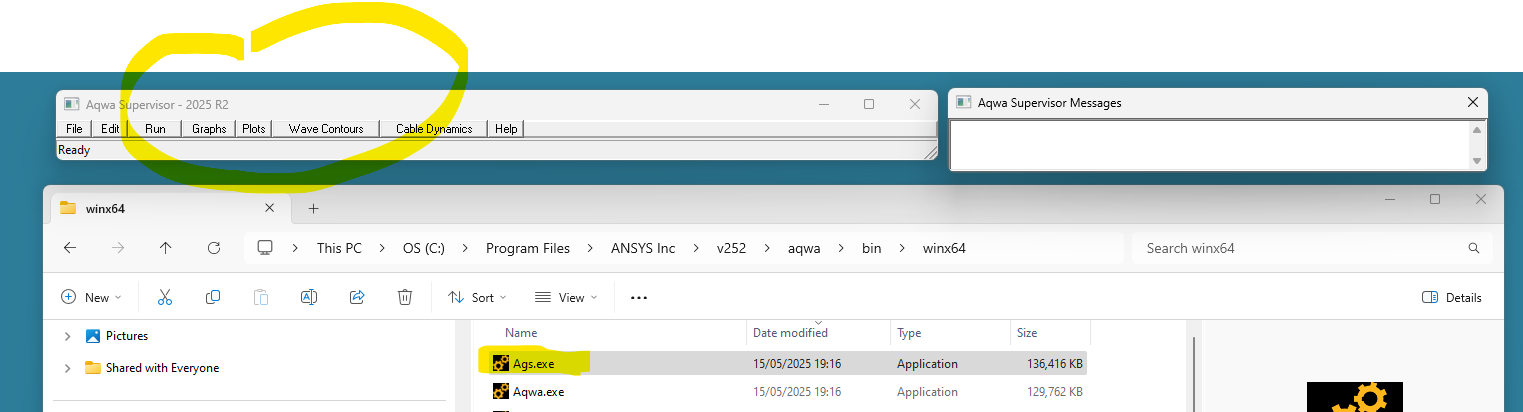
      (3) Double click on (your Ansys installation folder)\\aqwa\bin\winx64\Ags.exe, Aqwa Supervisor Window will appear

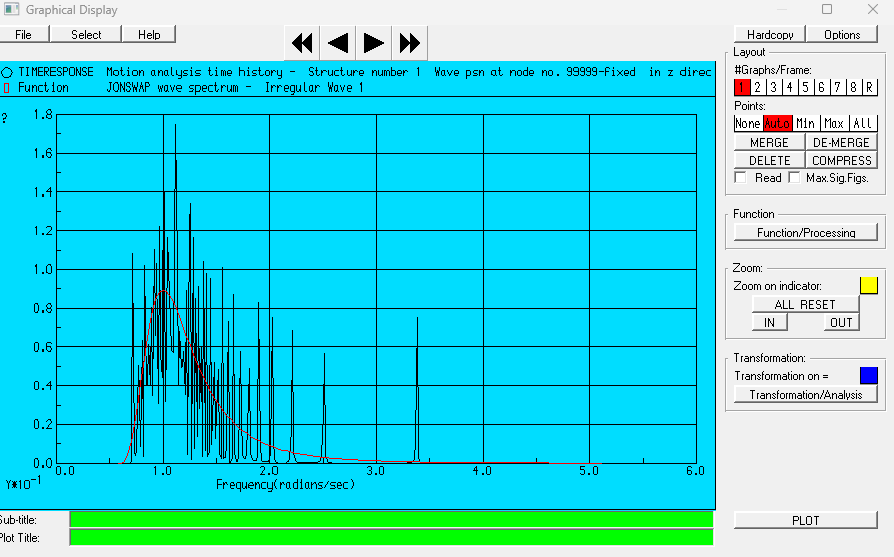
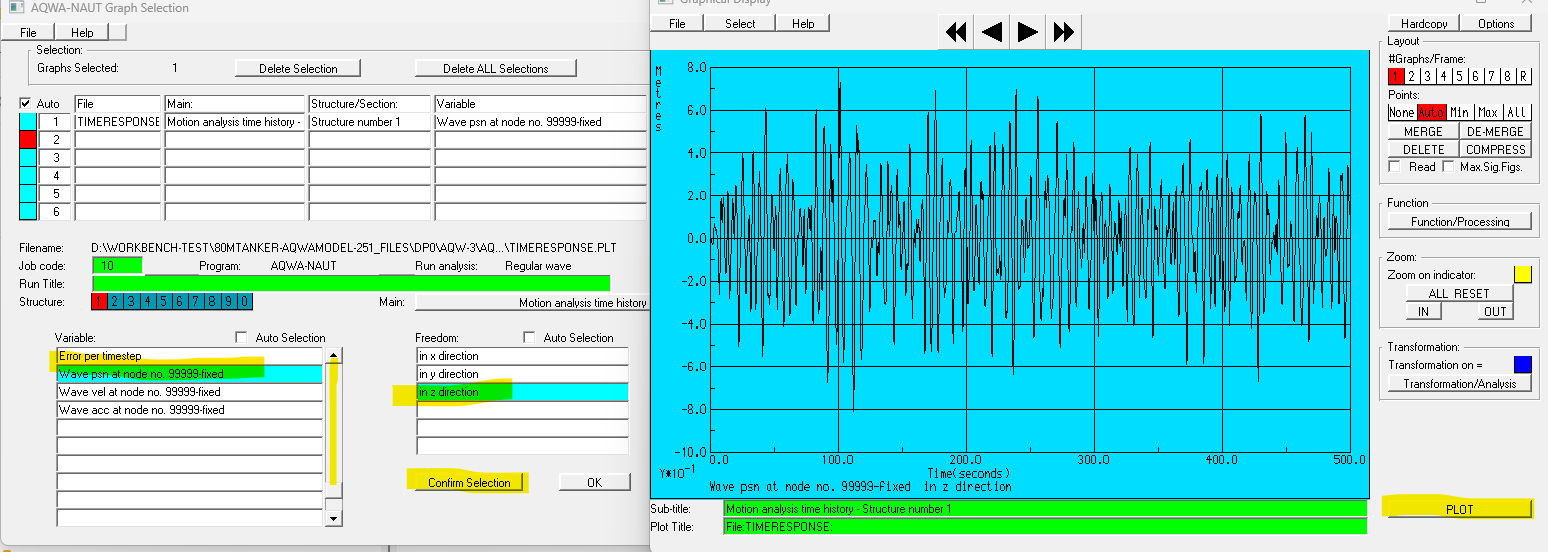
      (4) Click on File -> Open to import  TIMERESPONSE.RES in your project folder, then click on Graphs to import TIMERESPONSE.RES in your project folder. Select Wave psn in z direction, confirm selection, then PLOT, the time domain wave elevation will be plotted.

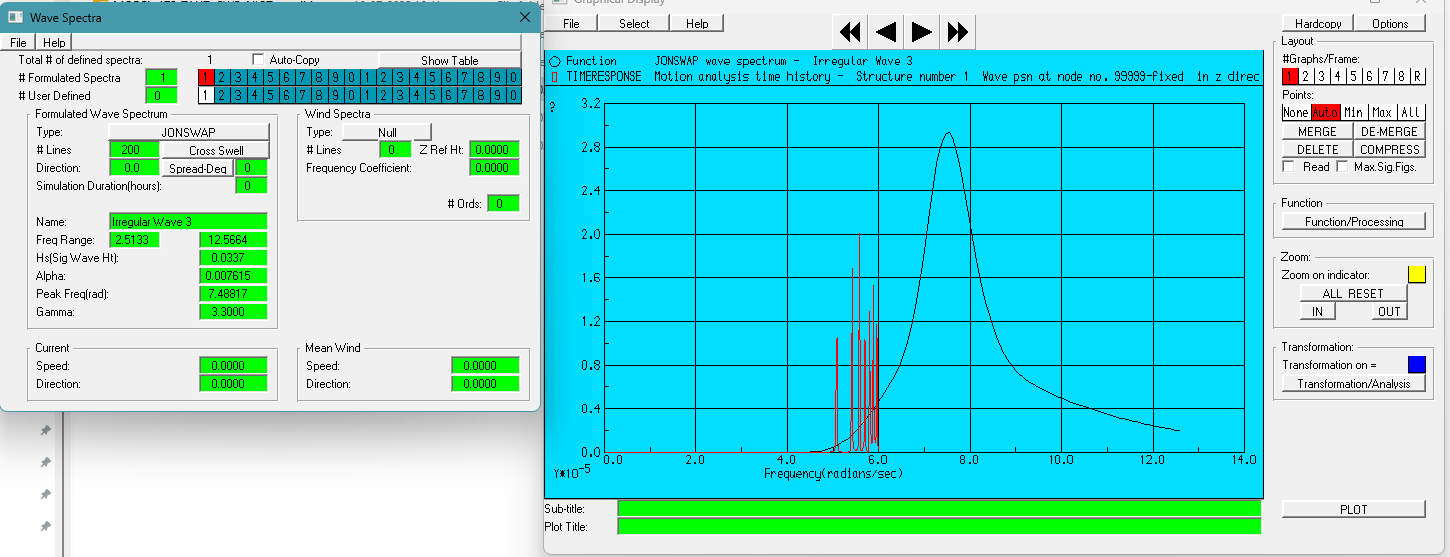
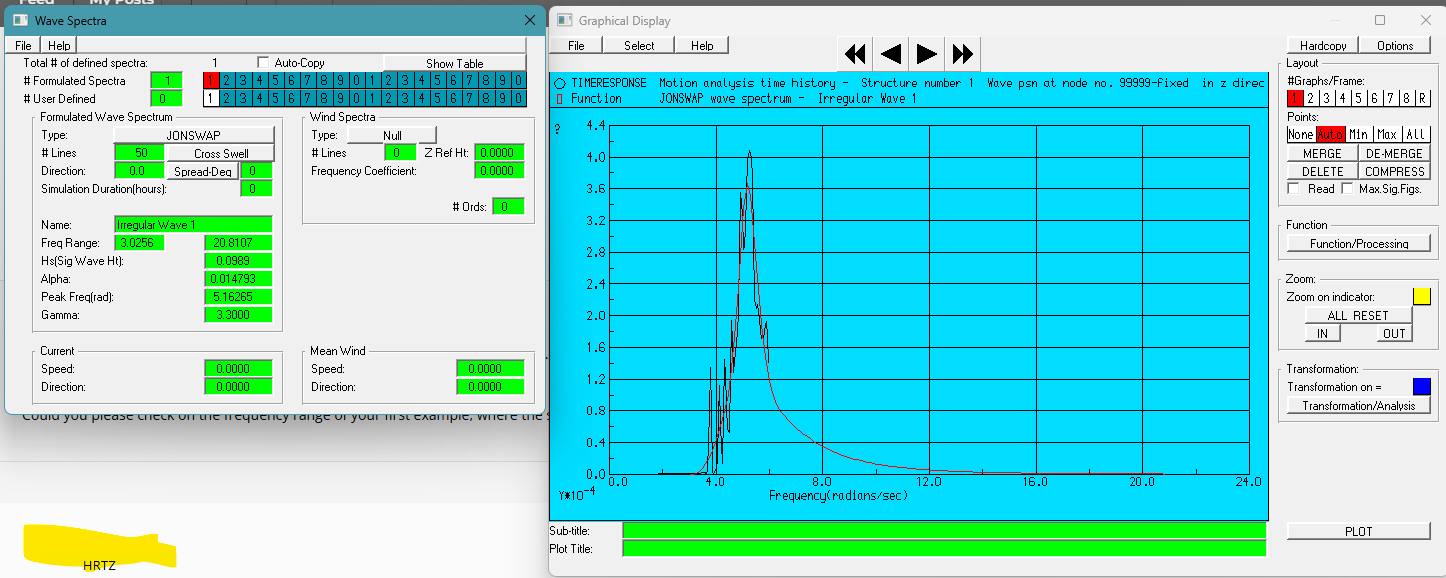
      (5) Click on the graph, -> Transformation/Anslysis -> Time/H -> Freq domain -> Power spectral density

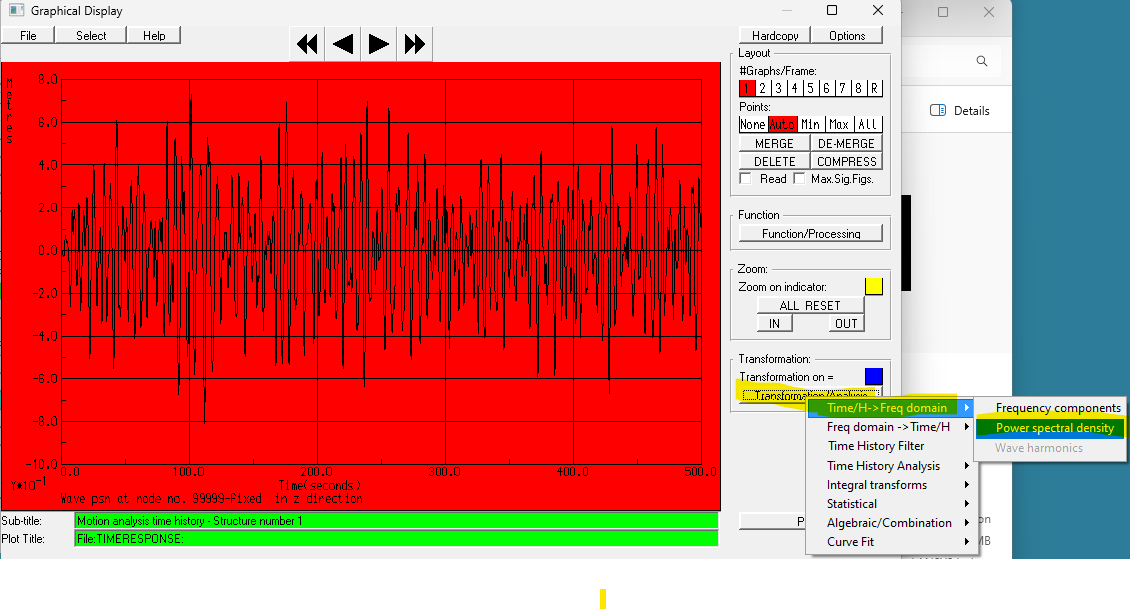
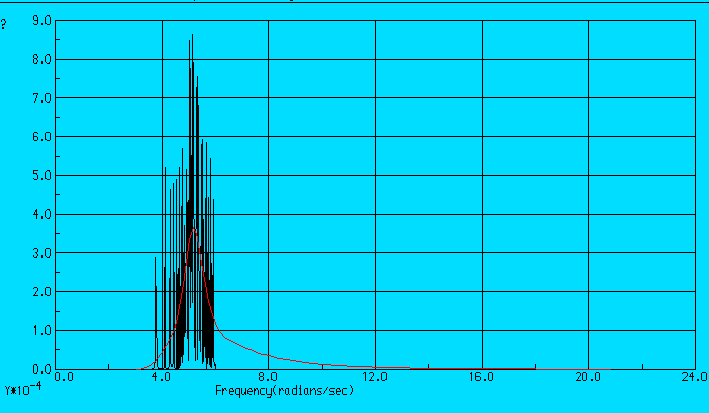
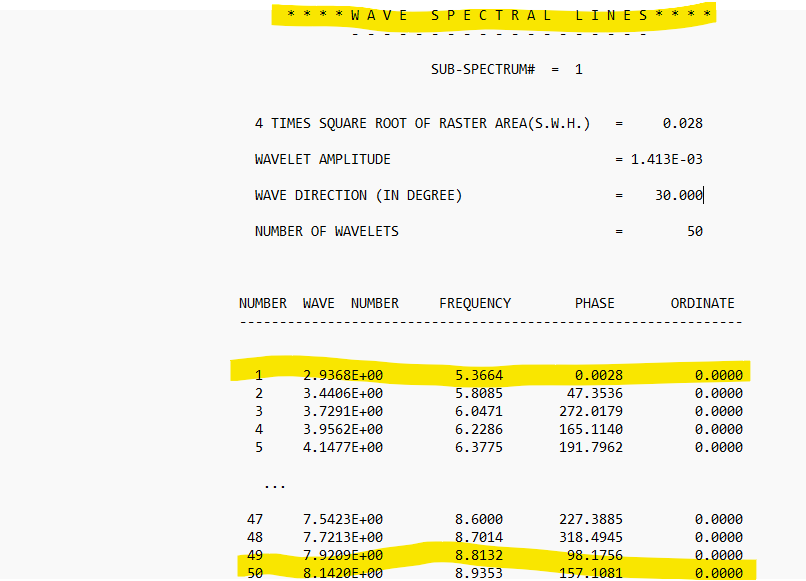
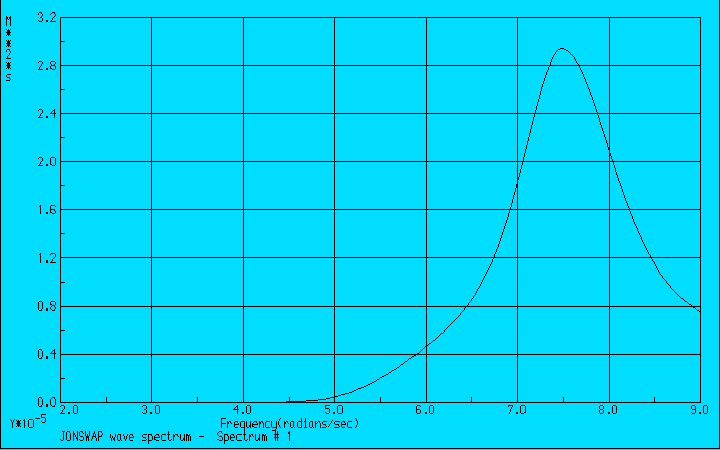
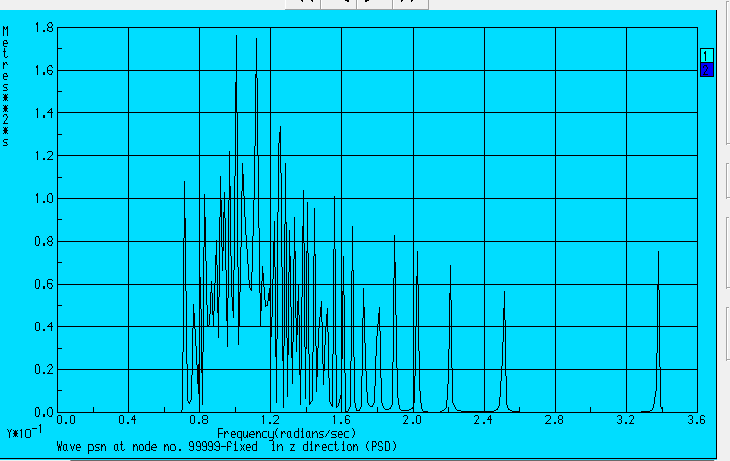
      (6) the swave spectrum density will display

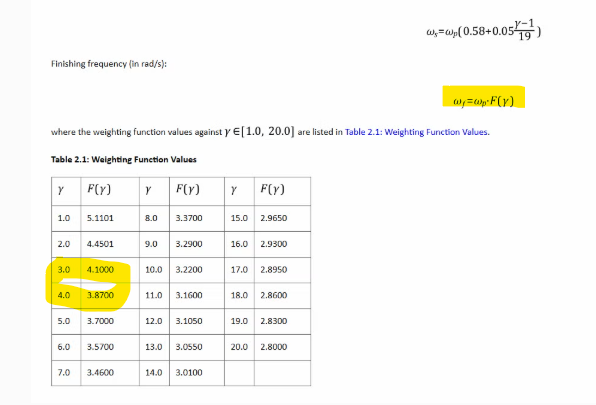
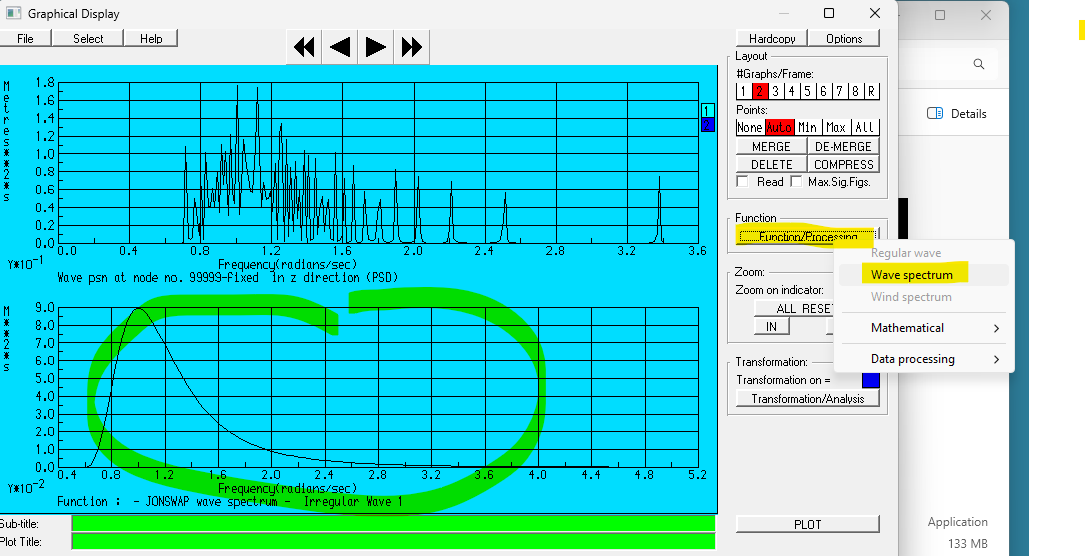
      The JONSWAP spectrum you defined can also be dsplayed by clicking on Function/processing

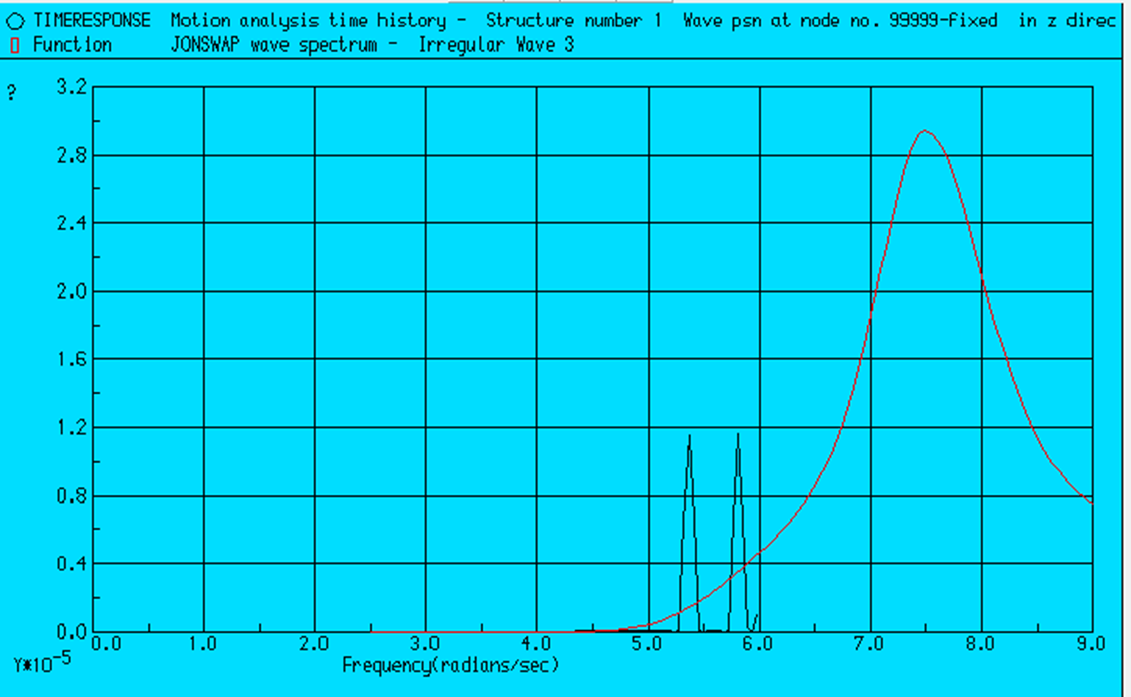
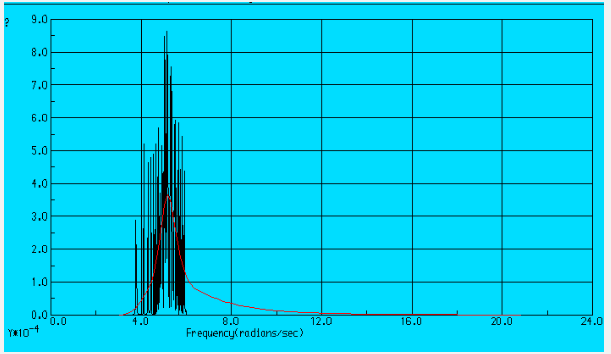
      (7) by holding Ctrl key and pushing Mouse left button on these two graphs, then click MERGE

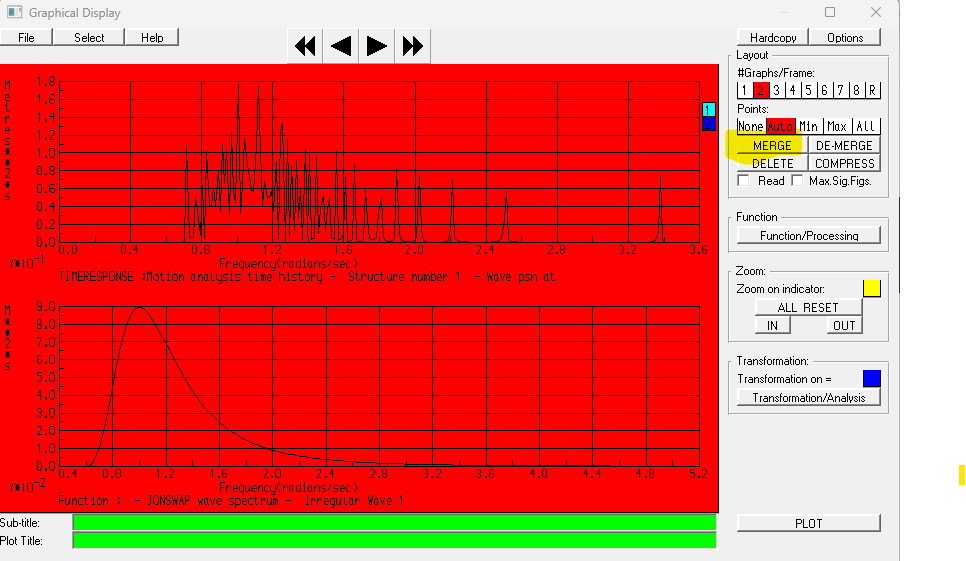
      finally you will have the comparison of these two data

    • NVN NAMMA
      Subscriber

      Thank you so much. It worked

      How will this work when we have currents also?


    • Shuangxing Du
      Ansys Employee

      Please see Aqwa theory manual 2.3.2. Wave and Current Interaction.

    • NVN NAMMA
      Subscriber

      To cover the majority of the frequencies in the JONSWAP spectrum, I adjusted the start and end frequencies in the simulation and used a duration of 500 s with a time step of 0.01 s. However, the results do not match the target spectrum. What could be the reason?


      The theoretical spectrum matches the given range, but the spectrum developed from the wave elevation does not match.


    • Shuangxing Du
      Ansys Employee

      Can you please show the data from Data Category 13 to Data Category 18 in (Your project)\dp0\AQW-?\AQW\AQ\Analysis\TIMERESPONSE.DAT?  Data Category 13 defines the wave spectrum. 

      • NVN NAMMA
        Subscriber

        *********************************** DECK 13 ************************************
        ********************************************************************************
                  SPEC
              HRTZ
              NAME          Irregular Wave 3
              WRMP          
              SPDN                  0.
              SEED         0
              NSPL        50
              JONH           0.3978874 1.4323945       3.3 3.3714e-2 1.1917799
         END
        ********************************************************************************
        *********************************** DECK 14 ************************************
        ********************************************************************************
                  MOOR
              LINE    197001    097000     3.645 13.377521
              LINE    197005    097004     3.645 13.377521
              LINE    197009    097008     3.645 13.377521
              LINE    197013    097012     3.645 13.377521
              LINE    197017    097016     3.645 13.377521
              LINE    197021    097020     3.645 13.377521
              LINE    197025    097024     3.645 13.377521
              LINE    197029    097028     3.645 13.377521
              DYNM
         END
        ********************************************************************************
        *********************************** DECK 15 ************************************
        ********************************************************************************
                  STRT
              POS1                  0.        0.    -0.296        0.        0.        0.
              POS2                  0.        0.-5.8803317        0.        0.        0.
         END
        ********************************************************************************
        *********************************** DECK 16 ************************************
        ********************************************************************************
                  TINT
              TIME     50001     1.e-2        0.
         END
        ********************************************************************************
        *********************************** DECK 17 ************************************
        ********************************************************************************
                  HYDC
              DRGM    1             1.
              ADMM    1             1.
              SLMM    1             0.
              DRGM    2             1.
              ADMM    2             1.
              SLMM    2             0.
         END
        ********************************************************************************
        *********************************** DECK 18 ************************************
        ********************************************************************************
                  PROP
              PRNT
              ALLM
              PMST
              PTEN
              PPRV    1
              GREV    1
              PREV    1
              TPRV    1
              TGRV    1
              ZRON
              NODE    199800
              ZROF
              ZRON
              NODE    199801
              ZROF
              ZRON
              NODE    199802
              ZROF
              ZRON
              NODE    199803
              ZROF
              ZRON
              NODE    199804
              ZROF
              ZRON
              NODE    199805
              ZROF
              ZRON
              NODE    199806
              ZROF
              ZRON
              NODE    299807
              ZROF
              WPON
              NODE    199999    099999
              WPOF
         END
        ********************************************************************************

    • Shuangxing Du
      Ansys Employee

      Normally within starting/finishing frequnecies, the wave energy should be at lease of 99% of the total wave spectrum energy. From the plot of the spectrum, it seems not the case. Can you make the finishing frequency to be higher.  Can you also set the numebr of wavelets to be 200 instead of default value of 50?


      • NVN NAMMA
        Subscriber

        Thank you, I will try that. Also how the number of wavelets affect the time series/spectrum? 

        starting and finishing frequency


    • NVN NAMMA
      Subscriber

      with higher finishing frequency.

      I understand that the issue lies with either the time series or the spectrum that has been developed from it. How does the peak frequency change?


    • NVN NAMMA
      Subscriber

      With more number of wavelets.

      Please help me identify why the time series lacks frequency greater than 6.0 rad/s. and the peak frequency does not match the theoretical spectrum


    • Shuangxing Du
      Ansys Employee

      With a wave spectrum, the irregular waves are represented by number of wavelets between the starting and finishing frequency range. In a time domain analysis, the actual wavelets' frequencies are defined by the program to ensure the same wave energy (or same wave amplitude) of each wavelet. By using more wavelets instead of 50, the waves are represented more accurately, but slightly time consuming in the numerical analysis.

      Note that you may have defined a wave spectrum for the seakeeping basin, as the signficant wave height is about 0.03m, and the frequency is in the order of 1 Hz. I wonder if you convert your model into the prototype size and define the equivalent sea wave condition, could this comparison work be better?

      • NVN NAMMA
        Subscriber

        Doing simulations on the prototype scale will not work for me. Now i am unable to understand why those frequencies are missing in the time series. and i am struggling to reproduce the old one, which had a better match 

        Here too, those frequencies are missing. In the hydrodynamic diffraction analysis, I defined a manual frequency range with a maximum of 2 Hz. Could this be related to the wave elevation in the hydrodynamic time response simulations?

    • Shuangxing Du
      Ansys Employee

      Your finishing frequency may be too small. Based on the equation below

      it should be about 1.1917799 * 4.0 = 4.76 Hz. 

    • NVN NAMMA
      Subscriber

      No, sir. The results are in rad/s so the maximum frequency would be 29.90 rad/s. (2*4.76*pi). The theoretical spectra are shown up to the given finishing frequency. In all the time series spectra, the maximum frequency is 6 rad/s. ie 0.954 Hz. Is there any modification required in the diffraction analysis?. 

      Could you please check on the frequency range of your first example, where the spectrum spans the entire theoretical spectrum?

    • Shuangxing Du
      Ansys Employee

      • NVN NAMMA
        Subscriber

        I think in this setup, it was manually given 2.5 to 9 rad/s (0.3978 to 1.4323 Hz).

        Parallel to this,  I attempted to use the diffraction frequency selection to program the control option. The following is the result obtained

        no waves after 6 rad/s


    • NVN NAMMA
      Subscriber

      Is there some (model parameter) which restricts the frequency?

    • Shuangxing Du
      Ansys Employee

      Yes, it could be the limit of 6 rad/s. For the real sea state, it is reasonable. Thank you for reporting it, I will check the code and may have a change. 

      • NVN NAMMA
        Subscriber

        Thank you so much👍

      • NVN NAMMA
        Subscriber

        As a result, I am currently constrained by the model scale in simulating wave conditions beyond the peak frequency of 1 Hz. I would greatly appreciate any suggestions or possible strategies to address this limitation

    • Shuangxing Du
      Ansys Employee

      you are welcome.

    • NVN NAMMA
      Subscriber

      So, I'm stuck with my model scale and can't simulate wave conditions beyond the peak frequency of 1 Hz. I would appreciate any suggestions or alternative approaches to overcome this limitation

    • Shuangxing Du
      Ansys Employee

      I will check the source code today to see if it is just the problem in the post-processing of doing FFT.

    • Shuangxing Du
      Ansys Employee

      It is confirmed that the Aqwa time domain analysis uses the wavelets in the frequency range of (5.366, 8.935) rad/s. Please see RESPONSE.LIS in (Your project)\dp0\AQW-?\AQW\AQ\Analysis

      The wave spectrum you defined looks like

      As I mentioned previously, the finishing frequency may not be correct.

      The 6 rad/s limit is just for post-processing, which does not affect your time domain response analysis, but your finishing frequency may do.


    • NVN NAMMA
      Subscriber


      Could you please explain to me where I went wrong?


    • Shuangxing Du
      Ansys Employee

      Nothing wrong. As I mentioned previous, when the finishing frequency is higher than 6 rad/s, please do not use this FFT post-processing function. Just check the wavelet information in the response.lis file, as you did, which lists the wavelets acutally used in the Aqwa analysis. 

Viewing 20 reply threads
  • You must be logged in to reply to this topic.
[bingo_chatbox]