-
-
April 3, 2025 at 10:22 pm
crumberger
SubscriberI have so far been unable to find a tutorial on constructing phase maps of surfaces in Zemax. (The closest thing I have found is a video tutorial in which the user imported a grid phase object and was therefore able to see the phase of the object imported.) I would like to be able to take an arbitrary slice normal to the propagation axis in a sequential optics simulation and capture it as a grid phase equivalent, either by exporting as a .zbf file or by copying the text output from the monitor. My expectation is that there should be a radial distribution of phase since the different rays travel different distances to reach the image plane and accumulate phase in proportion to distance travelled. I have attempted to view phase using two of the sample files: 1) Sequential>Objectives>Double Gauss 5 Degree Field.zmx and 2) Physical Optics>POP through a wave plate.zmx
In the former case, I always see 0 phase regardless of which surface I select:In the latter case, I see a constant or nearly constant phase. Also, I don't see any difference occuring based on which "Display>Project" option I select (i.e. "Along Beam," "Along Normal," or "Along Local Z") :
Of course, in this case, I'm sampling at the zone plate, so there may not be much phase accumulation yet. However, I see essentially the same thing when I insert a surface between the zone plate and the image plane and sample at that surface instead.Â
Does anyone have any insight into how to retrieve the correct phase information across the beam cross-section or know where to find a tutorial on the subject? Thanks. -
April 9, 2025 at 11:56 pm
Ethan Keeler
Ansys Employee
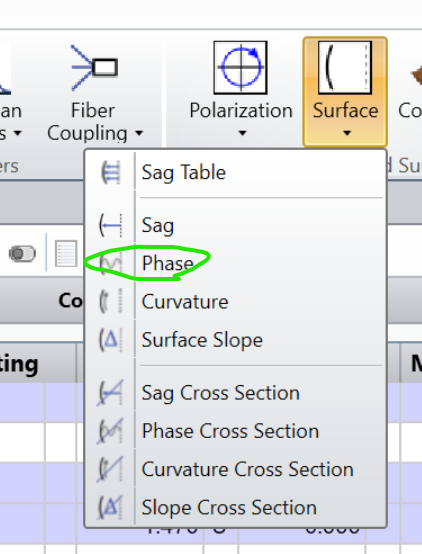
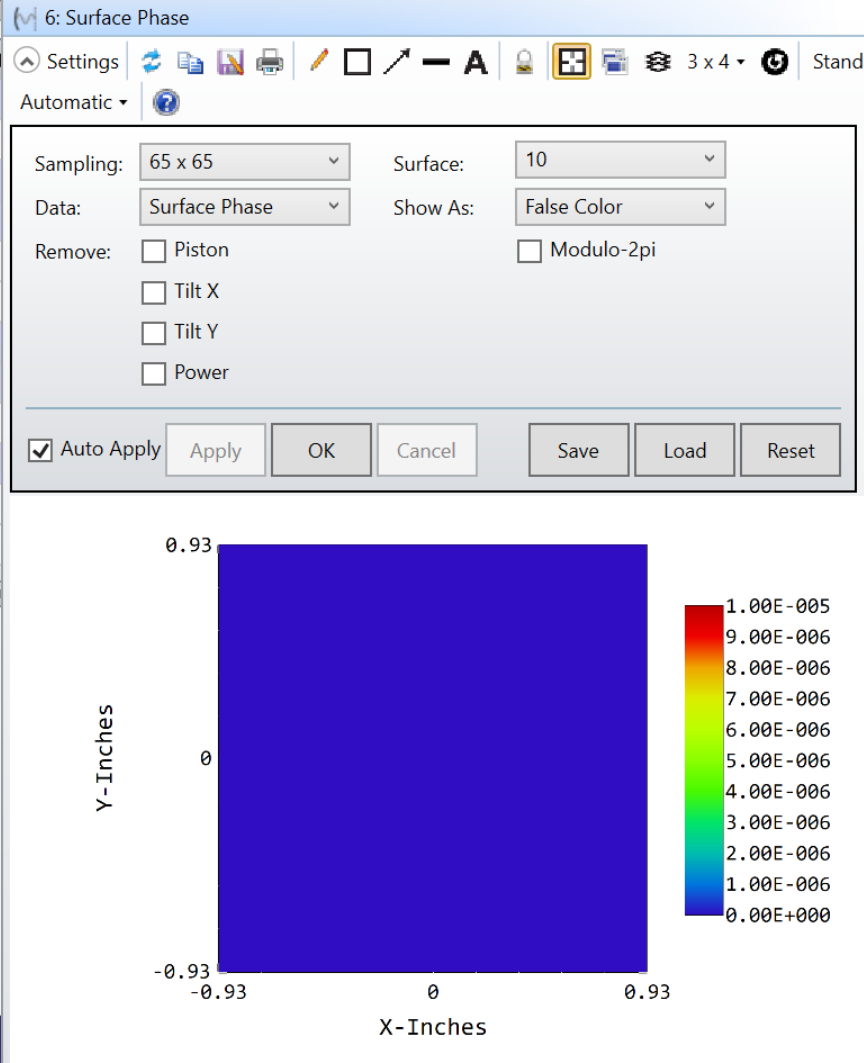
For your first example, the reason you see no phase is because the surfaces used in that design are simple Standard surfaces. These surface definitions themselves do no impart phase, unlike surfaces like Grid Phase or Binary surfaces. There are two way surfaces in OpticStudio add phase, either you have a sag profile defined for a refractive medium or you have an explicit phase profile defined (or both). The tool that you are looking at (Surface Phase) only would show a phase profile that is explicitly defined (think Grid Phase); however, it will not show the phase the beam accumulates due to passing through the shaped material at your Standard surface (some sag + refractive material).
To get the phase of the beam itself, I'd suggest using the Wavefront Map. There are some things to know about this tool, including the fact that it uses a reference phase, but there is a great discussion on it here: Wavefront map for arbitrary surface | Zemax Community.
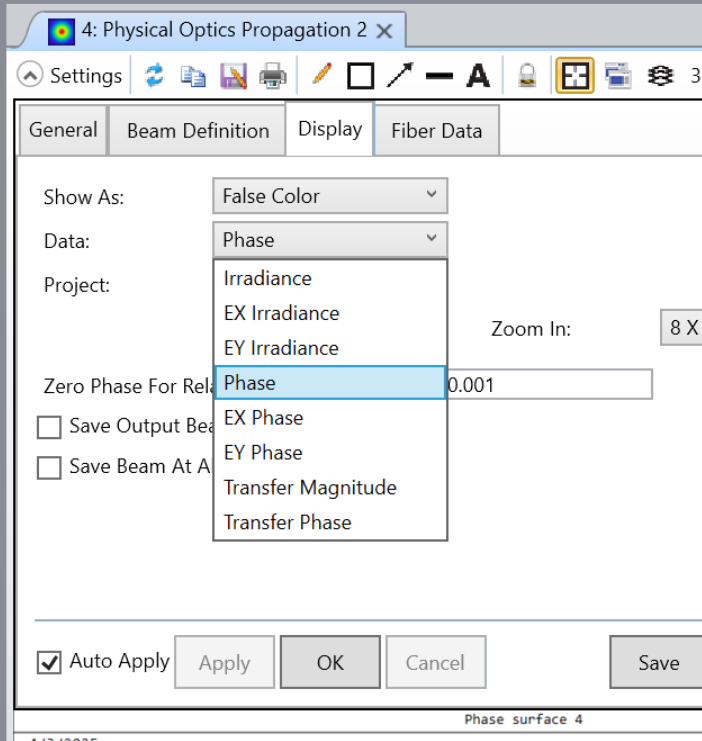
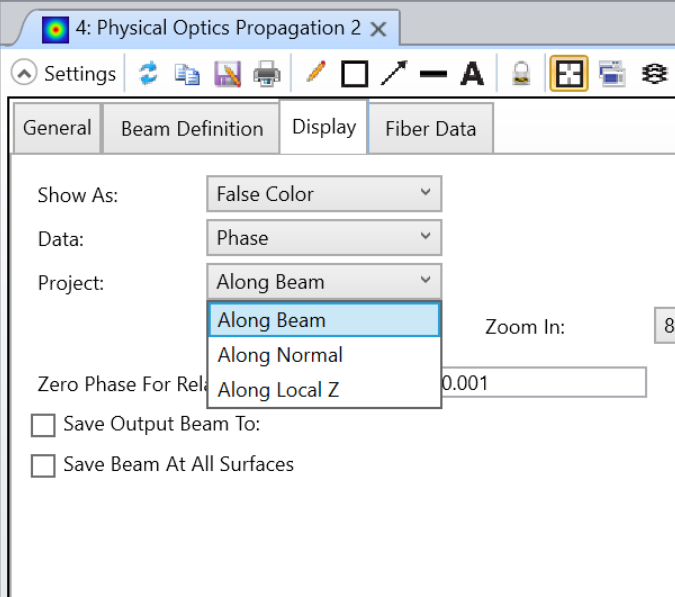
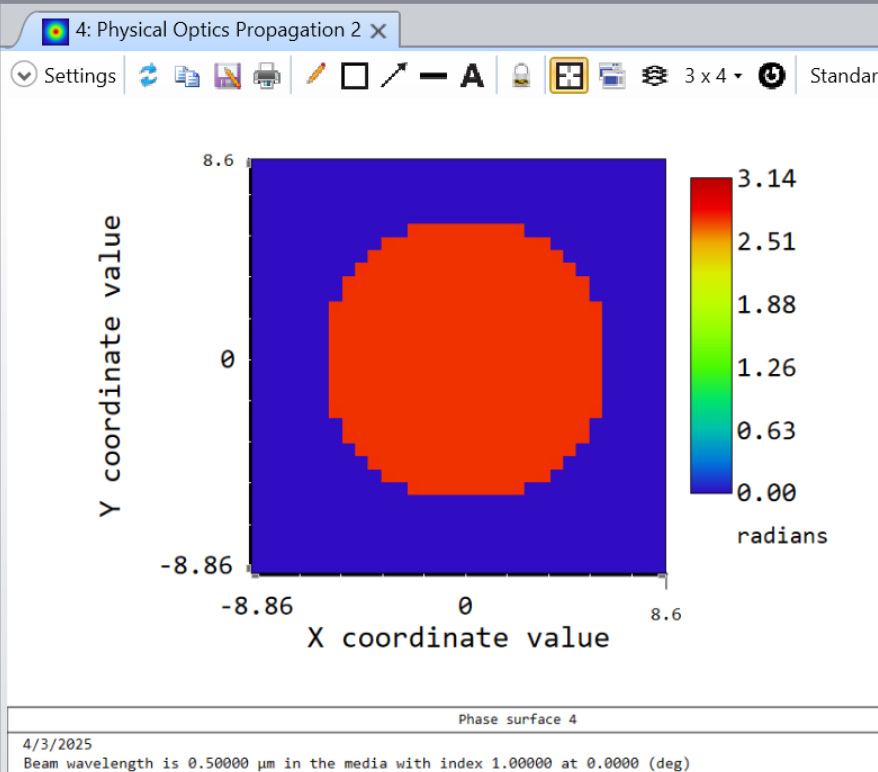
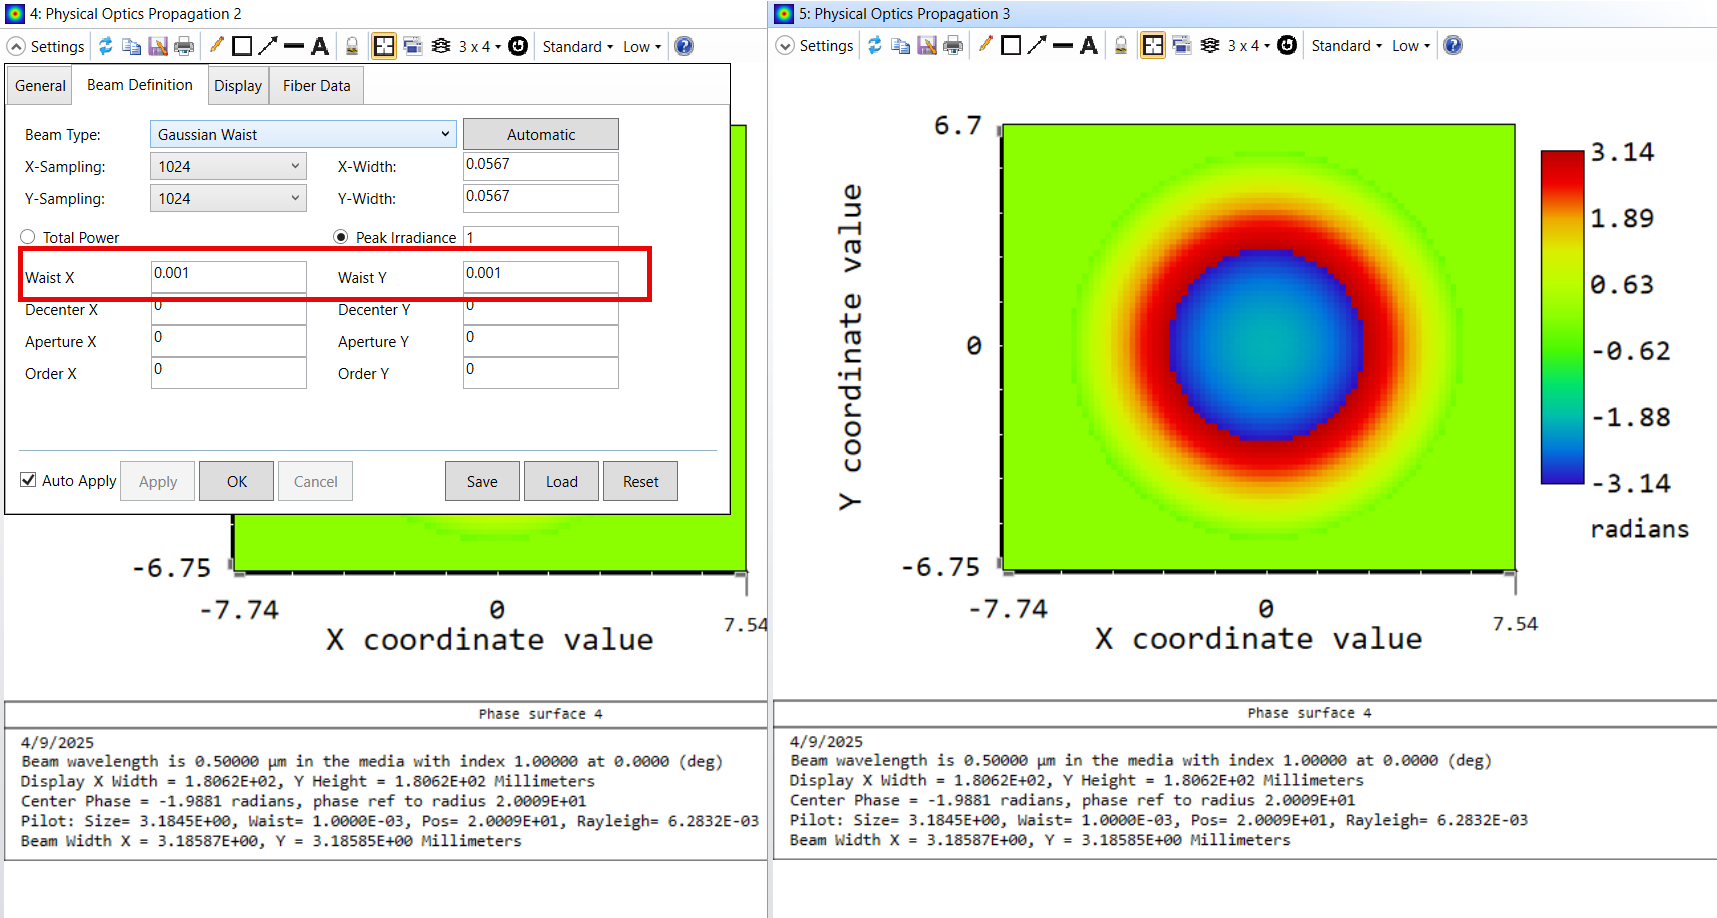
As for your question about the POP model, you're understanding of viewing the phase is correct. However, the particular file you are looking at has a very large Gaussian beam defined in POP. The Rayleigh Range is ~1.5E5 mm. Near the RR, we know that the phase front is flat, which is what you see in the viewer. Just for demonstration, I decreased the beam size so that we get sufficiently beyond the RR, and here you can start to see phase develop:
Let us know if these suggestions and tools are still unclear.
Ethan
-
April 10, 2025 at 11:15 pm
crumberger
SubscriberThanks for the response. I took a look at the linked Zemax conversation. It sounds like it's saying that the wavefront map shows only deviations from a reference sphere centered on the optical axis at the image plane. Is this correct? If I were to view the wavefront map as it appears at some distance before the image plane, would I actually be seeing the effects of distortion. (In other words, would a perfect diffraction-limited system show a flat wavefront map at all positions between the last optical element and the image?)Â
Note: For context, my intended application is to capture a phase map representation of distortion at some point in the optical train (preferably close to the image) to provide a template for a metasurface corrector where I can design a surface to do point-by-point phase correction. The process described in the small-scale metalens tutorial is directed toward creating a focusing element rather than a wavefront corrector.
-
April 15, 2025 at 4:13 am
Ethan Keeler
Ansys EmployeeÂ
The reference sphere is centered on the chief ray or centroid, depending on your settings. There is a very detailed explanation of this reference sphere here: RMS vs. Field. For a perfectly diffration-limited system, the wavefront map will not be perfectly flat as you describe. This is due to the fact that you still have diffraction, and it is unphysical for the rays to focus to a perfect point (as a spherical phase reference implies).
It sounds like an interesting project! Thanks for sharing the context here.
Ethan
Â
-
May 5, 2025 at 10:32 pm
crumberger
SubscriberThanks. Can you point me to a template for writing a .DAT file to import into Zemax as a phase grid element?
Details: I was able to export a wavefront at the first and last surface and write some code to define a point-by point phase profile of a metasurface based on that result. Now I would like to import that profile into Zemax as a phase grid. However, I am only able to find an online description of the sag grid format (https://support.zemax.com/hc/en-us/articles/1500005578182-How-to-write-a-Grid-Sag-DAT-file-programmatically).Â
I queried an LLM and it suggested using a header followed by the array of phases expressed as wave fractions (i.e. phi/2pi) rather than radians. It gave me the following as an example file:Â
ZEMAX PHASE DATA
NAXIS1 Â 3
NAXIS2 Â 2
XDEC Â Â 0.0
YDEC Â Â 0.0
XSIZE Â 10.0
YSIZE Â 5.0
DATA
0.0 0.1 0.2
0.2 0.3 0.4
I don't have a lot of trust for LLMs with this type of question, but Zemax was able to import that file as a grid element with no errors. However, it also did not have any effect on the Zemax simulation so I think this is incorrect. -
May 9, 2025 at 7:40 pm
Ethan Keeler
Ansys EmployeeYes, that format is not correct. For Grid Phase files, the syntax should look something like this:
nx ny delx dely unitflag xdec ydec z dz/dx dz/dy d2z/dxdy nodata . . .
The Grid Phase and Grid Sag files use the same format, so instead of defining a grid value of z, you would define the phase. We describe this in detail here Grid Phase and Grid Sag in the Zemax Help File.
-
May 12, 2025 at 10:31 pm
crumberger
SubscriberI was able to get the files to import correctly a few days ago, but I can't seem to get the results expected.Â
Starting with a predefined system (100 degree widefield objective from samples folder), here's my approach:ÂObjective: As an exercise, replace the three center optical elements with an equivalent grid phase element
Expected Result: Similar phase profile in the image plane as viewed in the POP tool for both the traditional and the hybrid system
Method:
- Export the wavefront profile (2048x2048) at stop surface (surface 10) and at surface 15
- Using a custom Python script, find the difference between the two phase profiles in radians, return the wrapped phase difference profile, and export it as a .DAT file in the Zemax grid phase format
- Import the phase difference grid phase as surface 10 in the original system
- Suppress surfaces 11-15
- Compare POP phase profile in image plane to that of original system
For step 1, I have tried both exporting from the surfaces of interest without modifying the system and also after suppressing intermediary elements to make the export surface coincide with the image surface, since the wavefront map is different for the image surface versus non-image surfaces colocated at the same position in the optical train. In both cases, substituting the center three lenses with an ideal grid phase equivalent did not result in a similar POP phase profile at the image surface. I was careful to use the same resolution for all wavefront operations. Does this general approach to the problem sound correct? I have been making use of the help files provided with Zemax as well as the online KB, but these have only been able to take me so far.
-
May 30, 2025 at 6:12 pm
Ethan Keeler
Ansys EmployeeIt sounds like you may be running into an issue with how Zemax references the phase. Many of the analysis tools do not give absolute phase, and instead usually phase referenced to a sphere. For this type of setup, you'll need to be careful about these references. There is a good amount of information here on the topic: How do OPD Reference settings in System Explorer\Advanced section affect wavefront calculation? | Zemax Community.
-
- You must be logged in to reply to this topic.
-
3357
-
1042
-
1030
-
870
-
826
© 2025 Copyright ANSYS, Inc. All rights reserved.