-
-
April 3, 2025 at 8:23 pm
gabriel.morais
SubscriberHello,
I've been working on a hollow core fiber simulation design and aiming to extract loss values across the 0.4 µm to 1.2 µm wavelength range, similar to the results presented in the article here: https://opg.optica.org/optica/fulltext.cfm?uri=optica-4-2-209&id=359511 (where they used COMSOL with finite element method).
Currently, I'm using SiO₂ with a constant refractive index of 1.45. My first guess for the effective index was 0.999957. Initially, I manually created a table with the effective index values and corresponding loss results. However, I now want to perform a sweep across the entire wavelength range to obtain a more comprehensive dataset.
I've attempted:
Frequency Sweep – but the results were not as close to the reference.
Optimization and Sweep Tool – but I'm unsure how to properly set up the sweep object.
Would you have any recommendations on how to properly configure the sweep to ensure accurate results?
Thanks in advance
-
April 4, 2025 at 9:03 am
Dimitris Polyzos
Ansys EmployeeHello Gabriel,
Thank you for contacting us.
I would suggest to use a frequency dependent material (SiO2) as it is depicted below.
In that way the change of frequency/wavelength during the frequency sweep will return the corresponding effetive refractive index for every frequency point you sweep.
For the correct use of Optimization adn Sweeps tools I wuold suggest to have a look at the following links:
In addition, I would recommend to conduct a convergence test as this might be one reason for not getting results close to the reference. In that way you can check if the mesh of the simulation region needs refinement up to a point that maximum accuracy is obtained. This might not be critical, but worth checking.
Convergence-testing-process-for-EME-simulations
I hope I helped.
Kind regards
Dimitris
-
April 4, 2025 at 8:05 pm
gabriel.morais
SubscriberHello Dimitris,
Thanks for the recommendations!
Regarding the material selection, I’ll try changing it again. I had attempted this in the past, but encountered an error message, though I’ll give it another go.
As for the optimization and parameter sweep setup, I tried running a sweep but ran into an "empty data" error (as shown in the image below). Do you happen to have any insights or suggestions to achieve better results? Also, how many sweep points would you recommend using in this type of simulation?
-
April 7, 2025 at 10:04 am
Dimitris Polyzos
Ansys EmployeeHello gabriel,
thanks for your reply.
I reckon that as the error message say the solver cannot find any modes. You could do a manual test to check the modes for each parameter and then proceed to a parameter sweep. The solver can find modes for your initial simulation and then it might not be able to find modes for every value of the parameter you are sweeping. The sweep should save the files from each iteration of the sweep in a subfolder, so you can try opening those files and running them to see what the issue is. I would also recommend to start with less parameter sweeps, for example 4 or 5 and then move to 20.
I think that you should decrease the number of modes that you attempt to calculate as well. I had a closer look and I noticed that the error is associated with the mode9, which means that you have set , I assume 10 modes, and the simulation of your structure can support 8 modes so the sweep cannot find any information for mode 9 and above. Again, I would recommend to use the steps in my previous paragraph and you will easily debug it.
Please let me know if you need further assistance.
I will be happy to help you.
Regards
Dimitris
-
April 8, 2025 at 8:58 pm
gabriel.morais
SubscriberHello Dimitris,
Thanks for this information. I checked the files manually in the 9-point sweep, and it turns out the issue was that the software couldn’t find the fundamental mode.
I tried adjusting the effective index initial guess to better capture the fundamental mode at 0.558 µm, but unfortunately, that didn’t solve the problem. Do you have any insights on how to improve this? Specifically, how can I stabilize the fundamental mode across the entire parameter sweep?
Regarding convergence testing, I’m not entirely sure which parameters would have a significant impact on my system. Would modifying the span region or mesh refinement be the right direction?
Looking forward to your suggestions!
-
April 9, 2025 at 7:42 am
Dimitris Polyzos
Ansys EmployeeHello Gabriel,
I reckon that for start you should change the wavelength from 0.4 um to 0.558 um, and decrease the number of trial modes to somehitng like 10.
The fundamental mode should be found for a specific wavelength and then you should perform a frequency analysis from the Frequency analysis tab. Then you can click to Frequency plot and choose "loss" to be plotted versus wavelength. This willbe for the fundamental mode that you chose. You can see how to navigaate to the Eigensolver Analysis tab from the images below:
Regarding the convergence test I would recommnend to test only the mesh starting from a coarse mesh and getting to finner. At some point, there will be a mesh ize that beyond it the returned results are stable and have no contribution to the accuracy of them. Regarding the span I would recommend to do a convergence test of 3 points (you can do that manually as well). In general, the span should be enough large in order to confine the modes (choose fundamental) without chopping them in the BCs (you can check that by setting log scale at the E field visualization and see the Efield at tbe BCs, if it is less than 1e-6 the span is adequate and there is no need to make it larger).
I hope I helped
Regards
Dimitris
-
April 11, 2025 at 7:48 pm
gabriel.morais
SubscriberHello Dimitris,
Thanks for the information and recommendations!
I’ve tried adjusting the settings for the number of trial modes, but the reason I’m currently using 100 is because when I lower this number, I start getting the “no physical modes were found” error.
I also ran a frequency analysis, but I believe using the parameter sweep is the better approach here, since my goal is to plot a graph of loss (log scale, dB/km) vs. wavelength (µm) over that frequency range.
So far, I’ve obtained some good results using the parameter sweep, with search in range selected for the modes.
I do have two additional questions:
- To achieve a good-quality plot (similar to the reference graphic), how many wavelength points would you recommend including?
- Do you have any suggestions for a script command to generate a plot of loss (log dB/km) vs. wavelength (µm) using the parameter sweep data?
I’d really appreciate any further tips or recommendations you might have.
Thanks in advance!
-
April 14, 2025 at 9:55 am
Dimitris Polyzos
Ansys EmployeeHello Gabriel,
Thanks for your reply.
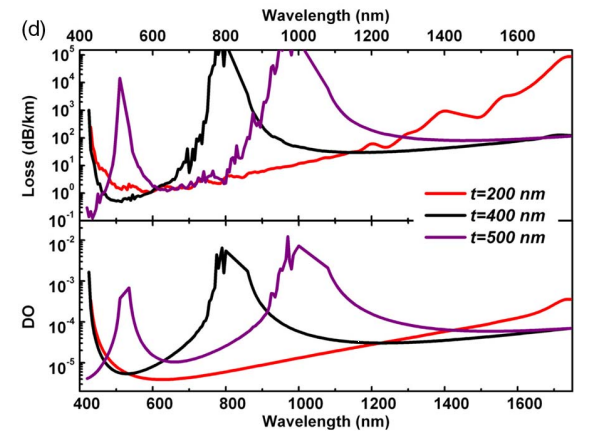
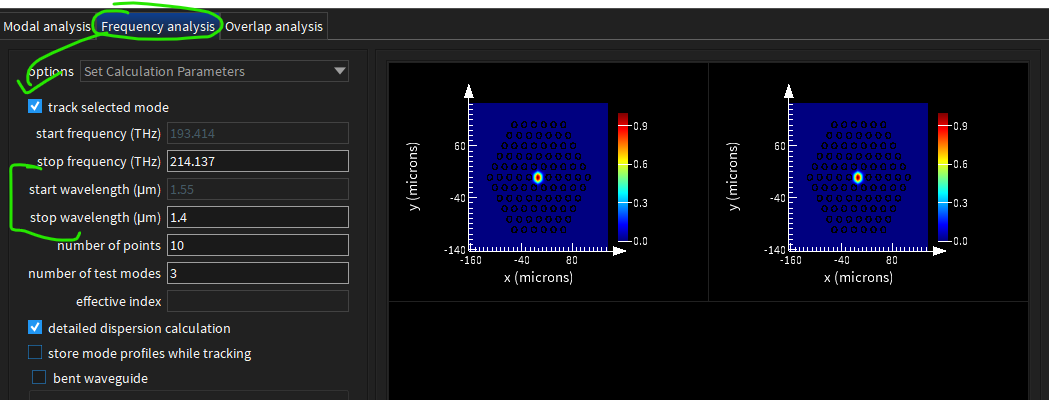
I cannot say for sure a specific number of wavelength points but a rule of thumb would be as many your simulation can hold. As you can understand there in order to reproduce the plot from the reference the resoltiuion should be ideally 1 point per wavelength, where as I can see from the reference that the wavelength spans from 400 nm to 1600 nm. Even if you use 1 point per namometer you will need 1200 wavelength points which sound a bit of excessive to do so. Fo that reason I would recommend to try reproducing a small region from the reference (x = 50 nm) where a peak is depicted as you can see in the following figure:
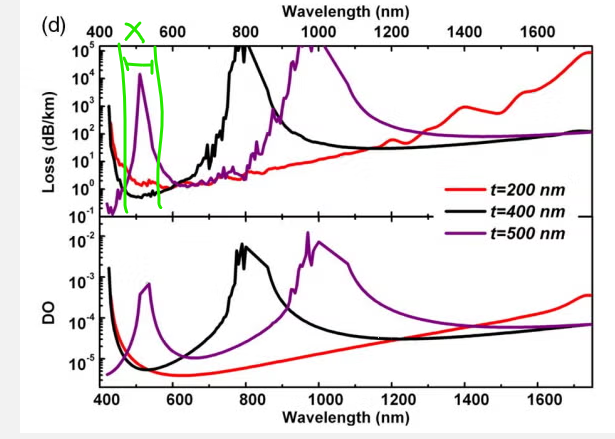
Try to use 50 points with resolution of 1 nm and check your results. Then I would increase the wavelength resolution to the full span of the reference with 10 nm or 20 nm per point. That depends on your computer resources and simulation time available, as it can run for hours in order to get a high resolved wavelength region.
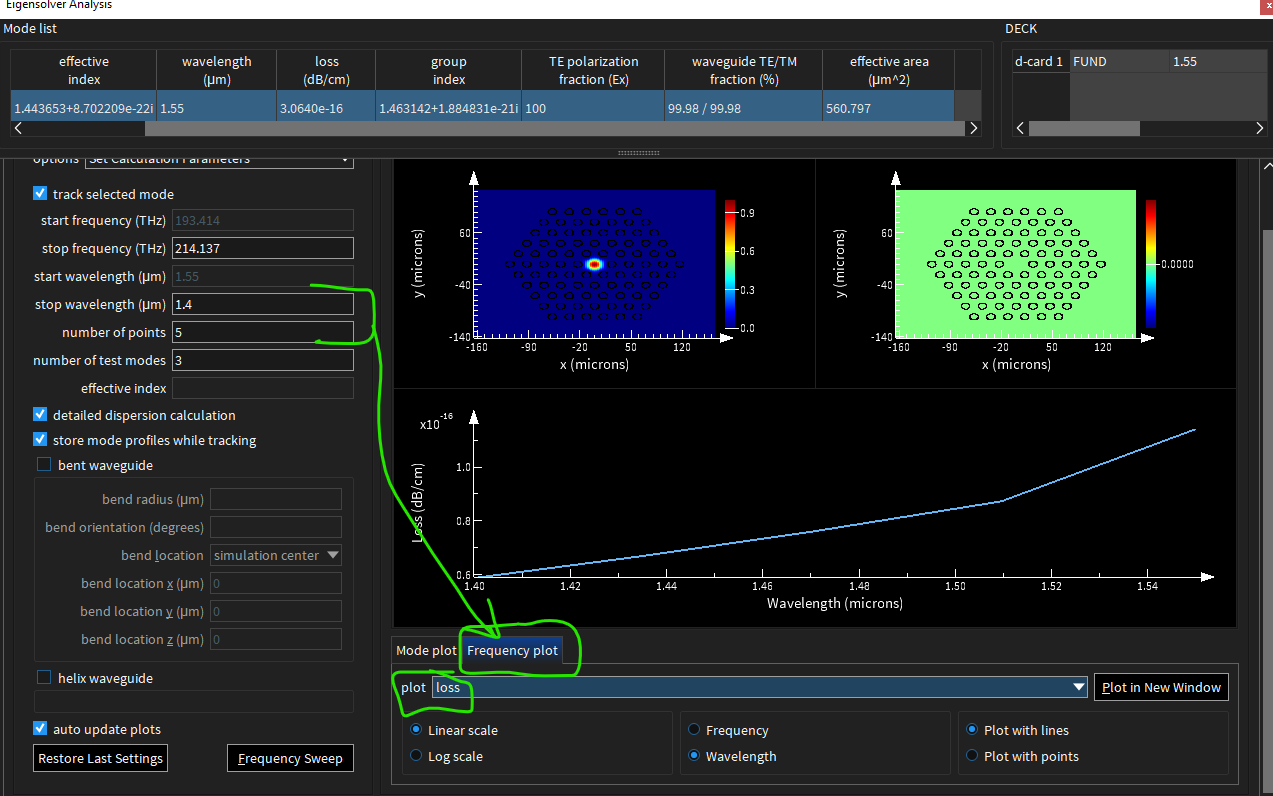
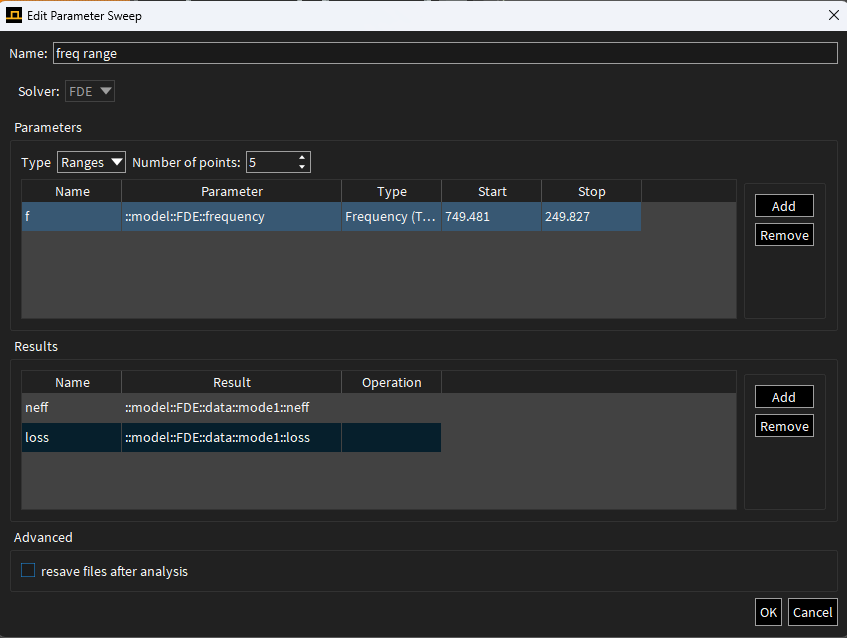
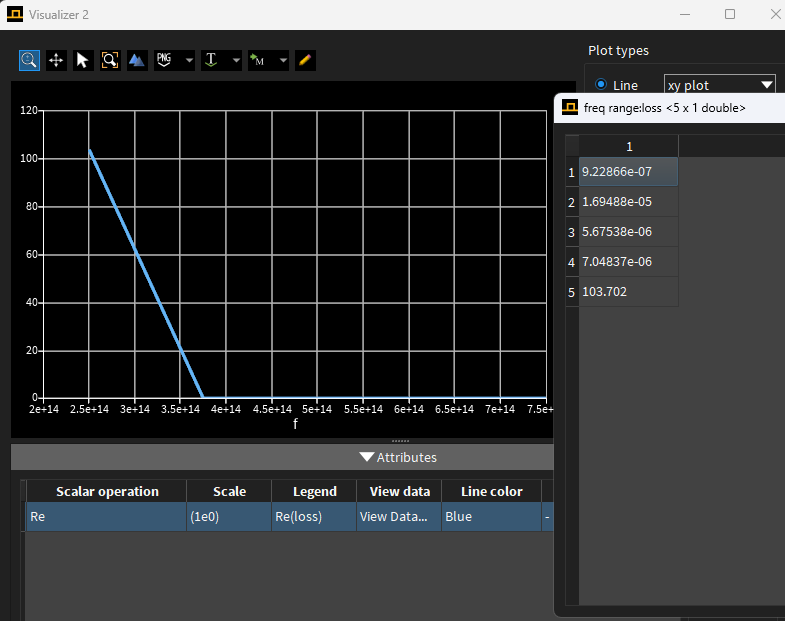
Regarding your second question a simple script loop could be used to get losses for each wavelength. You can modify the following script to your needs:
wls = [1.5e-6,2.4e-6,8];
neffs = matrix(1,length(wls));
for(wl = 1:length(wls)){
switchtolayout;
select("FDE");
run;
setanalysis("wavelength",wls(wl));
findmodes;
neffs(1,wl) = getresult("mode1","neff");
loss(1,wl) = getresult("mode1","loss");
}
plot(wls,loss(:,1)/100,'wavelength)','Loss');
I hope I helped.
Regards
Dimitris
-
April 24, 2026 at 8:21 pm
dr.dilnashin
Subscriberwhat should be the typical FDE region. what should be the outer jacket thickness. the PML region should it be inside the glass jacket or outside the jacket. i tried keeping it inside glass jacket , my loss keeps fluctuating while expanding the pml region. plz help
-
April 27, 2026 at 7:55 am
Dimitris Polyzos
Ansys EmployeeHello,
it has been a while since last time we spoke. I hope you are well.
A typical FDe solver region should be large enough to include all structures of your simulation model. In a previous post of mine I share a screenshot where the simulation region inlcudes all structures of the optical fiber. The PML region should be outside the glass jacket.
I hope I helped.
Kind regards
Dimitris
-
- You must be logged in to reply to this topic.
-
6284
-
1906
-
1457
-
1308
-
1022
© 2026 Copyright ANSYS, Inc. All rights reserved.


