Hello everyone !
I am working on the simulation of the melting of a phase change material, a paraffin wax named RT40. I want to visualize the phase change on a time-temperature diagram with ANSYS-FLUENT.
Initialy the RT40 is set to 293 K, the cylinder to 323 K. (Phase change is around 311 and 316 K)
I created on ANSYS-ICEM a cylinder closed on both side as the picture below :
As far as i know my mesh is fine, my criteria were :
- Angle > 18 °
- Quality > 0.3
- Aspect Ratio <1000
- Determinant >0.3
- Volume change <10
- Erikson skewness >0.8
Tell me if something is wrong with these criteria.
On Ansys-Fluent, i turned on the "energy" model and the "solidification and melting" model.
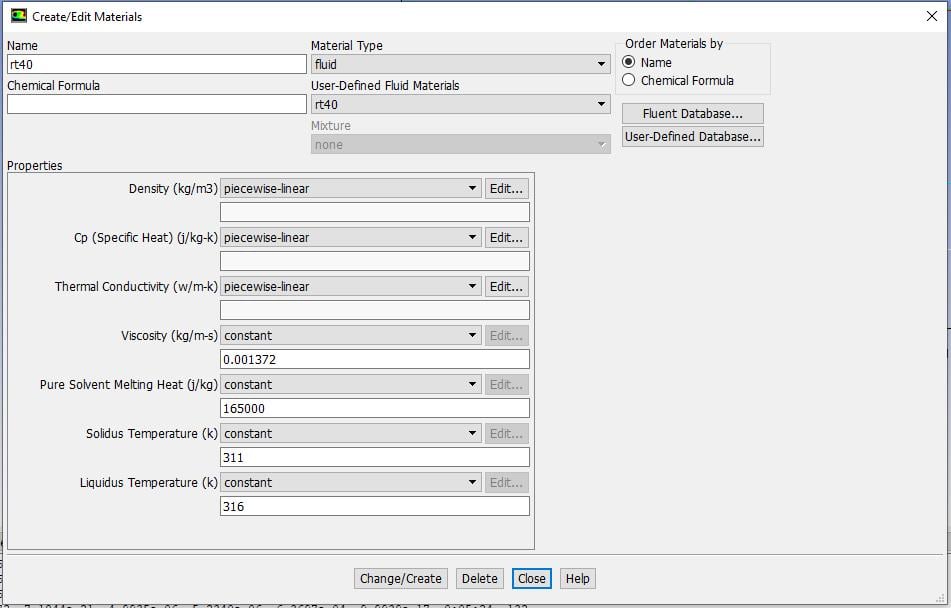
I created a material named rt40 with the following properties :

For the density, the specific heat capacity and the thermal conductivity i choose a piecewise-linear model with 4 points (273 - 311 - 316 - 373 K for the temperature) :
I fixed the temperature value of the cylinder to 323 K :

For boundaries between PCM and the cylinder, "coupled" was chosen : (The picture only show the bottom boundary)

For boundaries between the cylinder and the exterior, i just made them adiabatic :

The following pictures shows the methods and controls used :


Then i initialized and patched the PCM zone to 293 K , the cylinder zone to 323 K.
I created 3 points in the center of the cylinder to visualize when my melting is over and the phase change plateau.
The following picture shows my parameters for the calculation :

The residuals are set to 1e-6, i choose 1000 for "Max iterations/Time set" to ensure that the beginning of the calculation converge.
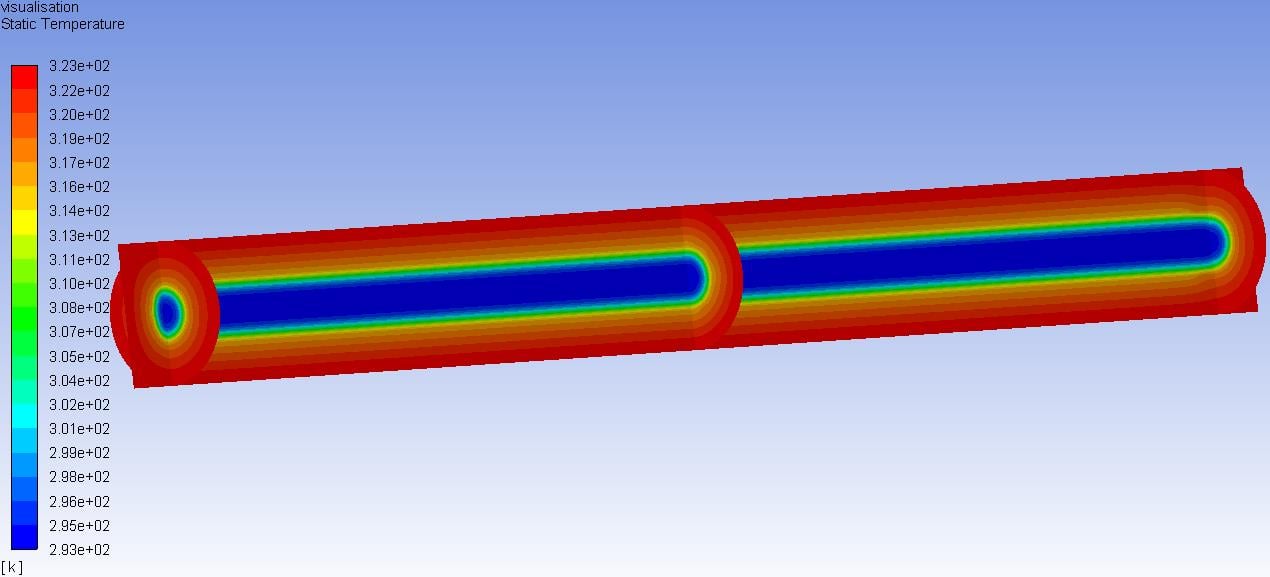
Now my problem is this :

This is a plot of the temperature of a point in the middle of the cylinder. But we can't see a plateau where the phase change appears.
Where is/are my errors ?
Best regards