Hi
I am building a transient flow model. Flow flows through a pipe and i am trying to calculate the temperature at the outlet.
I have attached my workbench project file here. There are two projects in the workbench please refer to the project named 'This one'.
Here it's what I have done and the problem i am facing.
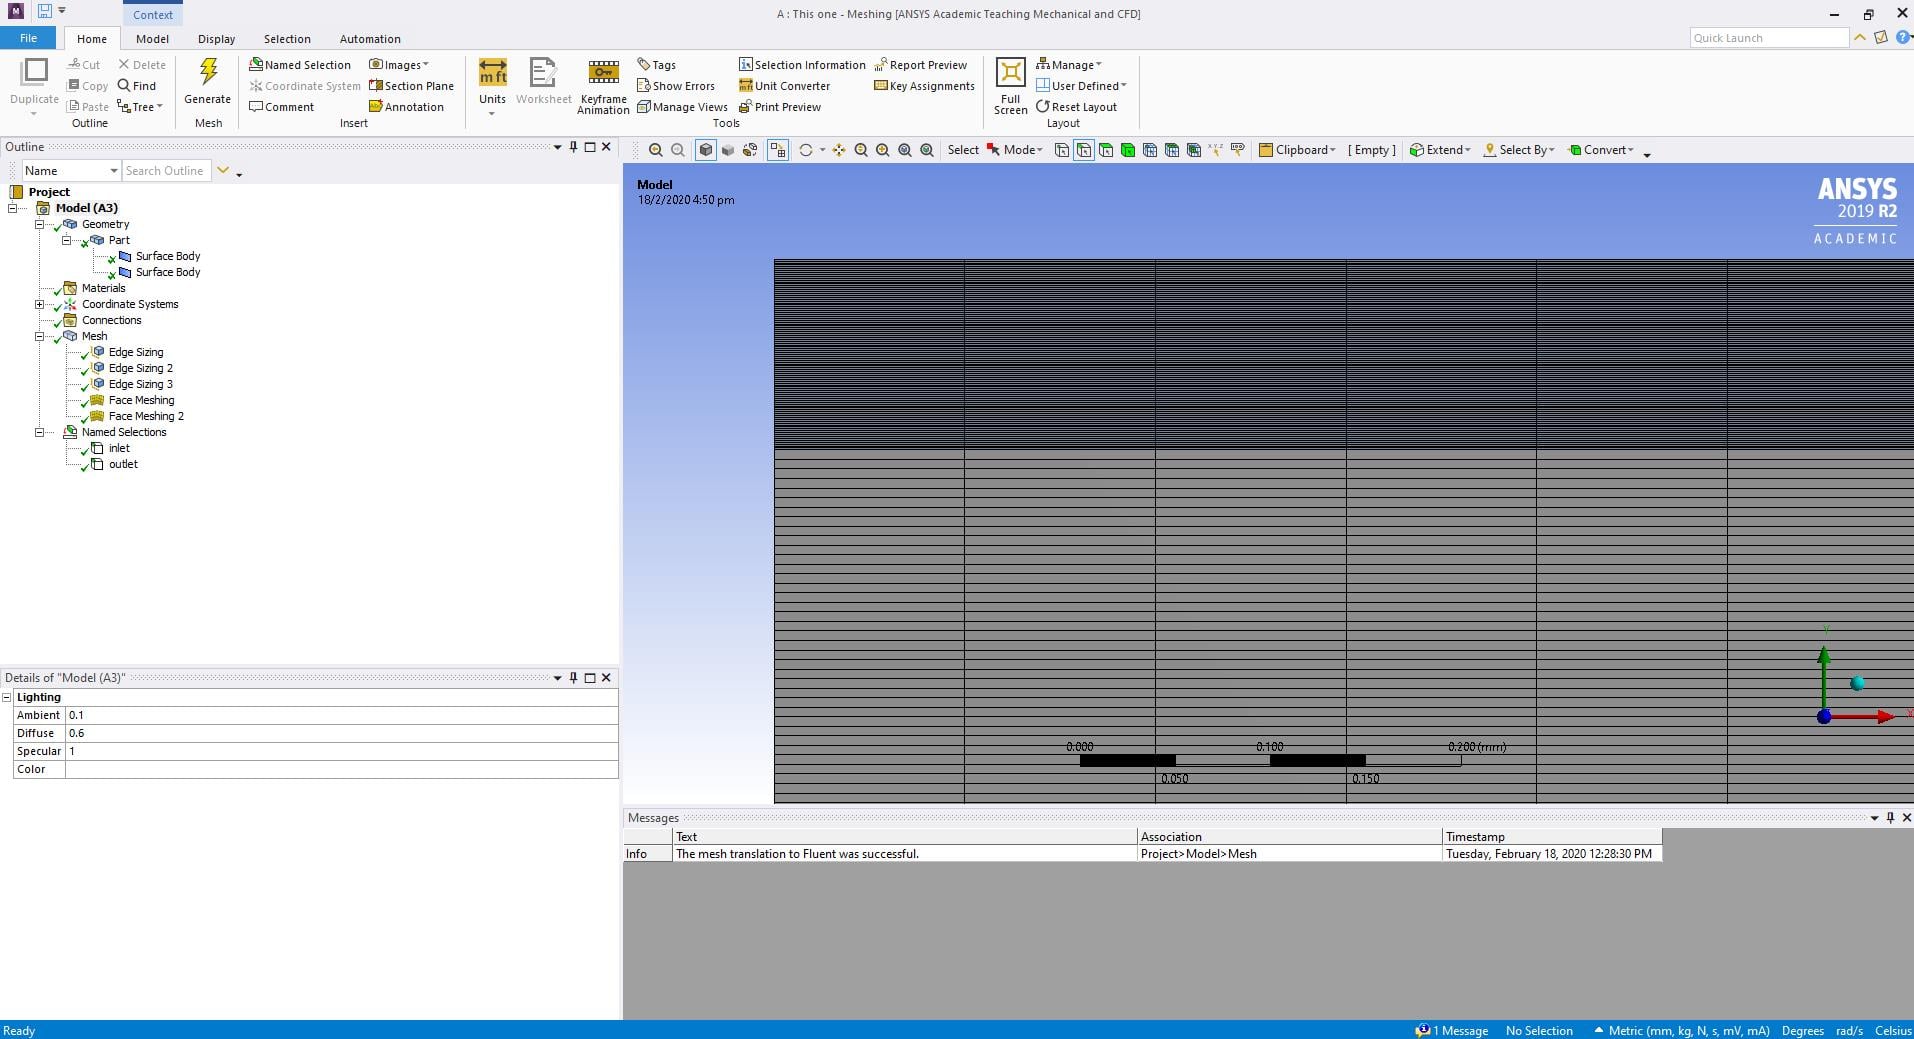
Below is the 2D planer model i built. Bottom is solid which has initial temperature of 312K and above is flow zone which has initial temperature of 300K. it's length is 100mm.

This is mesh. along the length the numeber of division is 1000. height is divided into 100 element for each solid and fluid part.
And for calculation:
Energy model is on.
boundary condition is presented as below. inlet is left end of the flow zone and outlet is the right end of the flow zone.
this is scheme code for the boundary assignment:
(ti-menu-load-string "define/boundary-conditions/zone-type 8 pressure-outlet")
(ti-menu-load-string "define/boundary-conditions pressure-outlet 8 yes no 0 no 297.5 no yes yes no no")
(ti-menu-load-string "define/boundary-conditions/zone-type 7 velocity-inlet")
(ti-menu-load-string "define/boundary-conditions velocity-inlet 7 yes yes no -0.1 no 0 no 1 no 0 no 310")
(ti-menu-load-string "define/boundary-conditions/solid 3 no no no no no 0 no 0 no no")
(ti-menu-load-string "define/boundary-conditions wall 10 0 no 0 no yes coupled no 1")
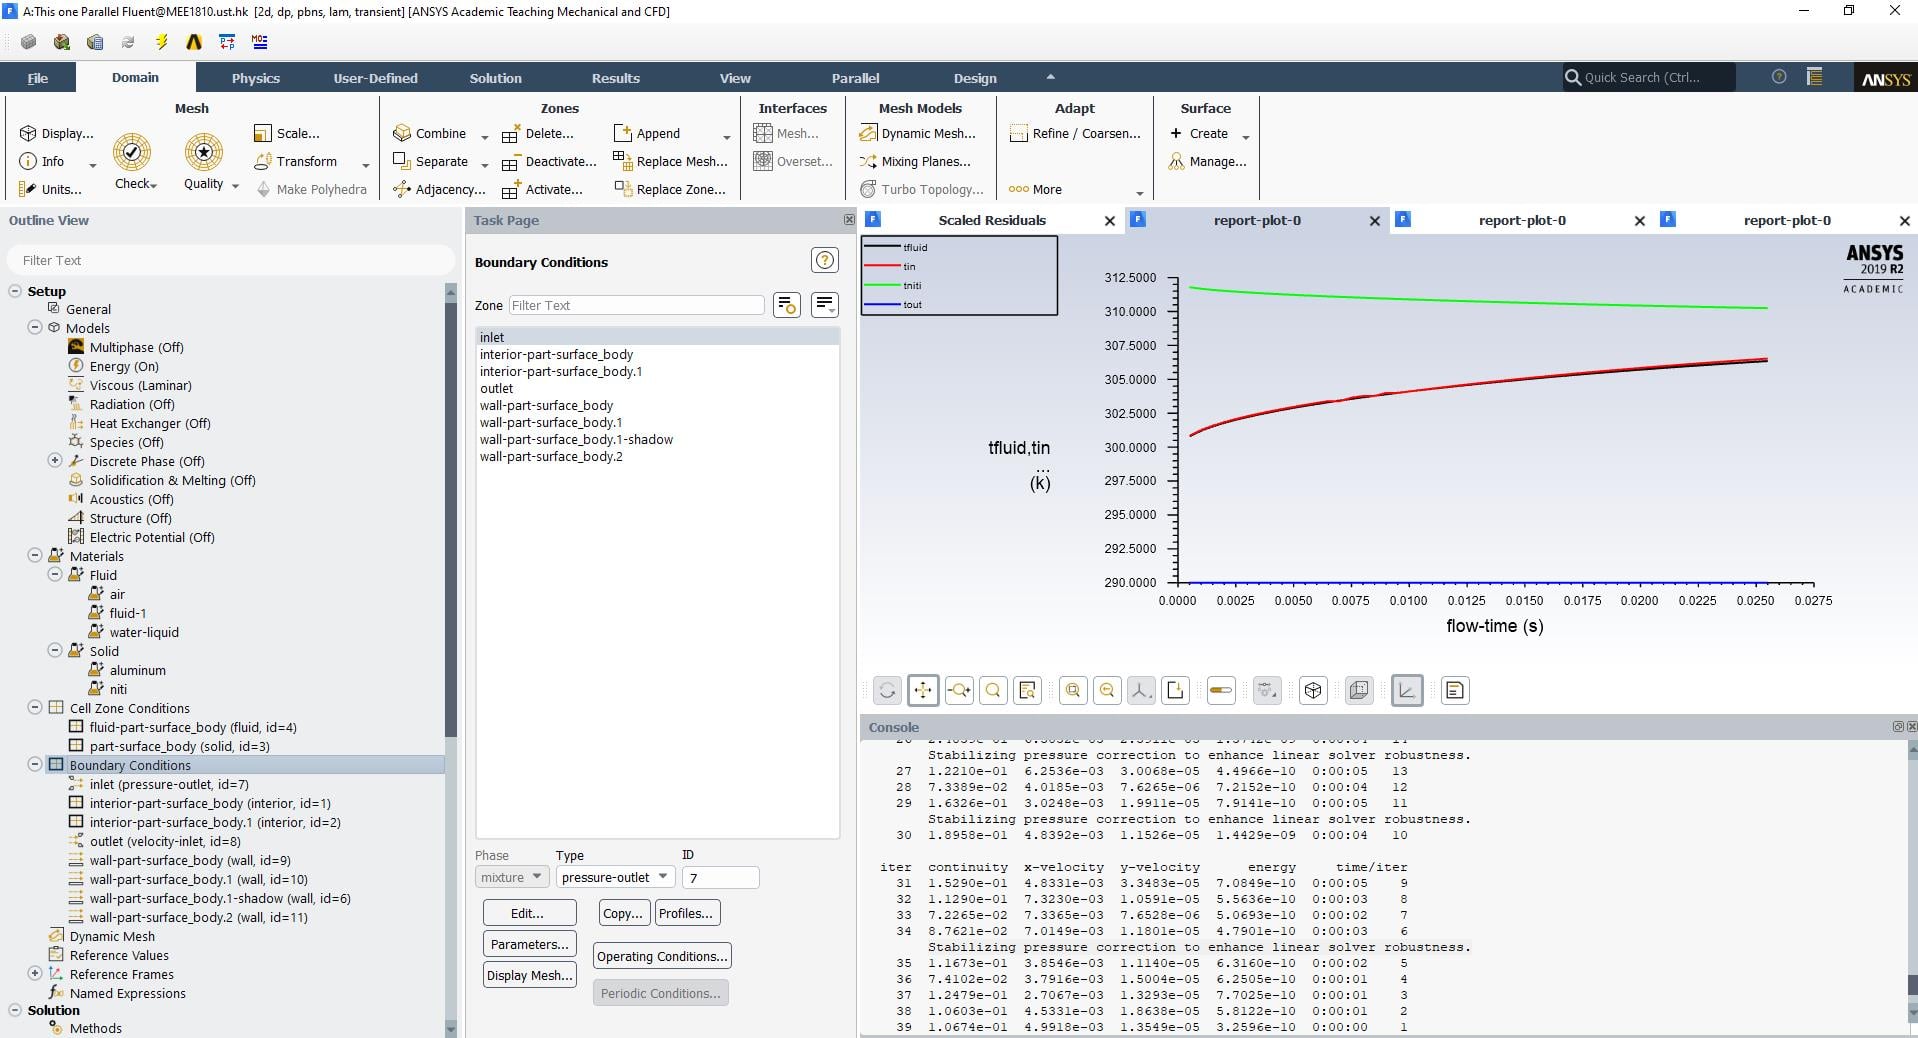
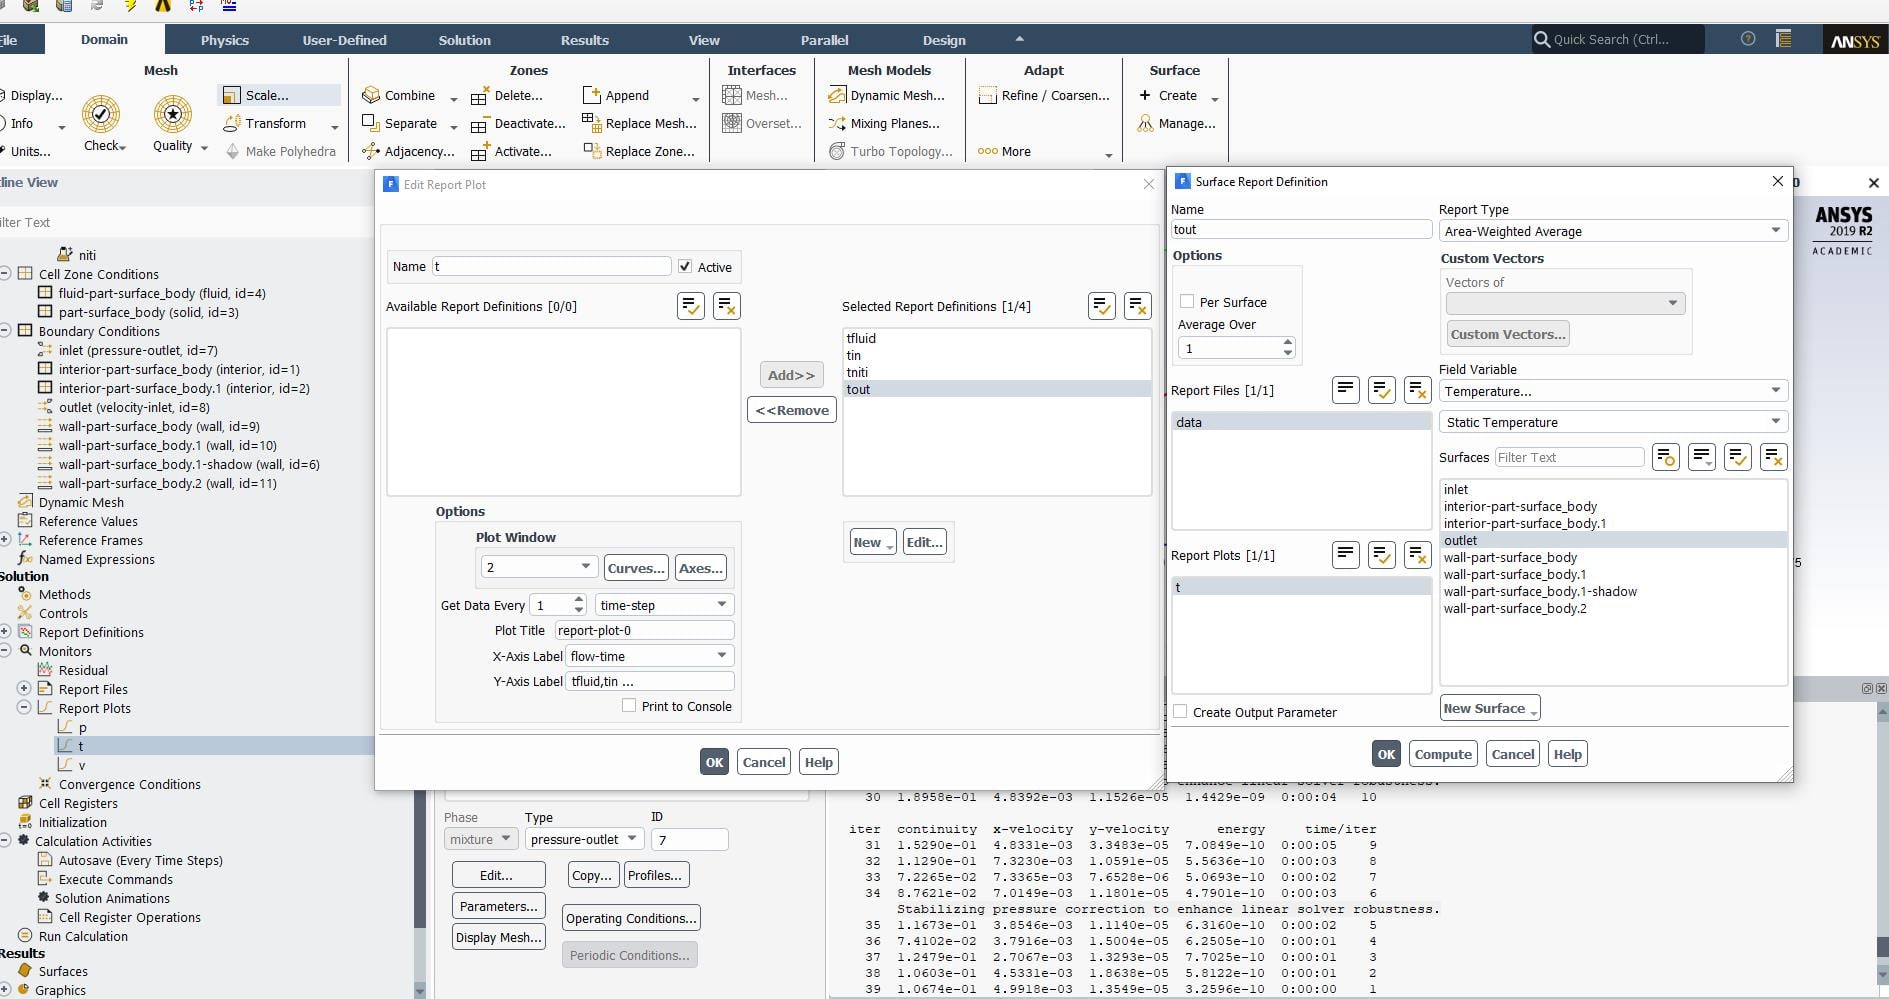
This is how details of outlet temperature plot
area weighted average at the outlet boundary.
Along the flow direction, the minimum size of mesh is 0.1mm and the flow velocity is 0.1m/s. so the time step size is 0.001.
I applied initilization patch on the solid so its initial temperature to be 312. and the fluid temperature is 300. The inflow temperature is 297.5.
The result show as presented below: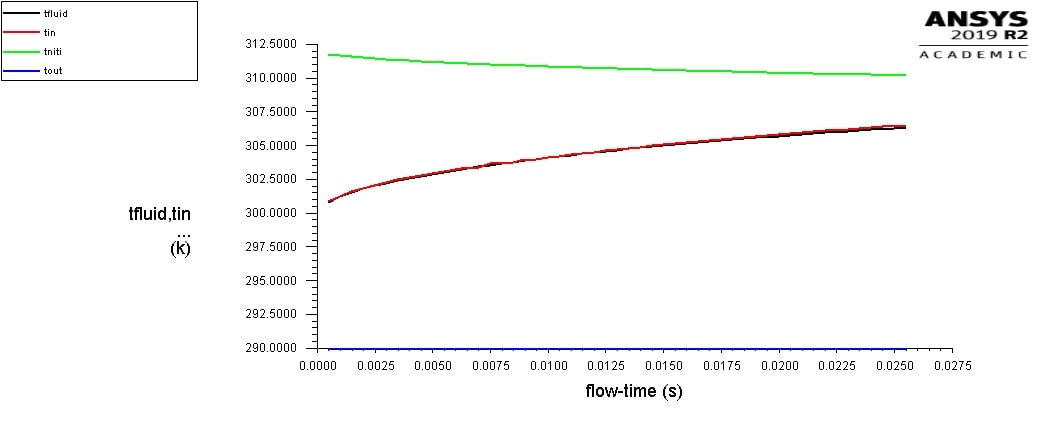
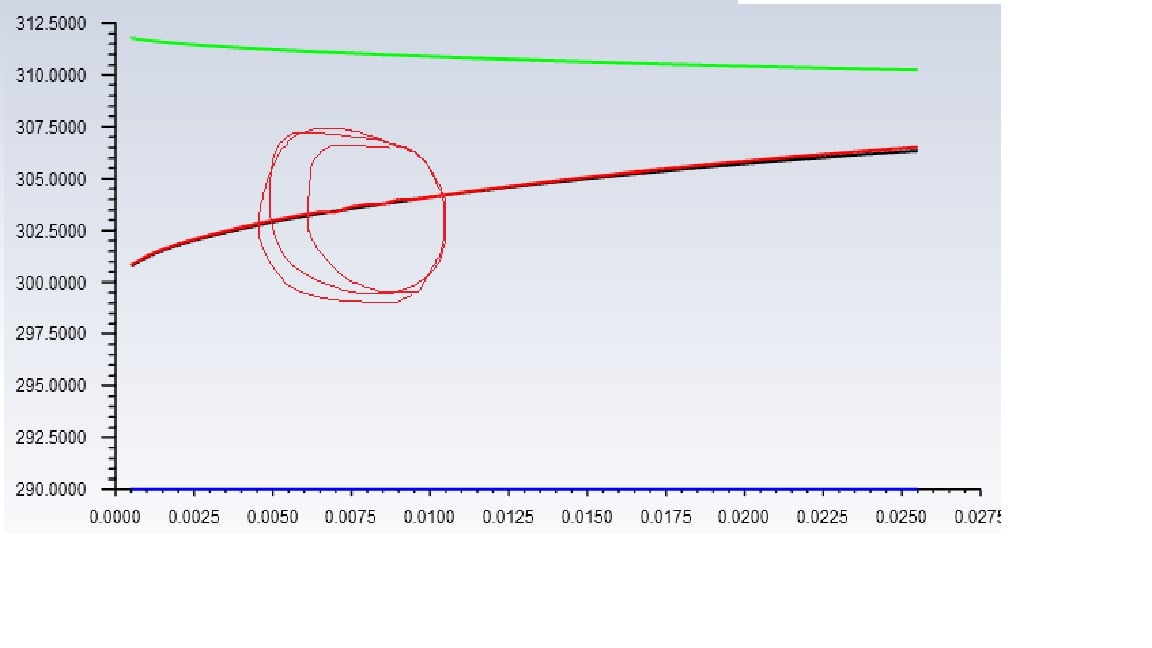
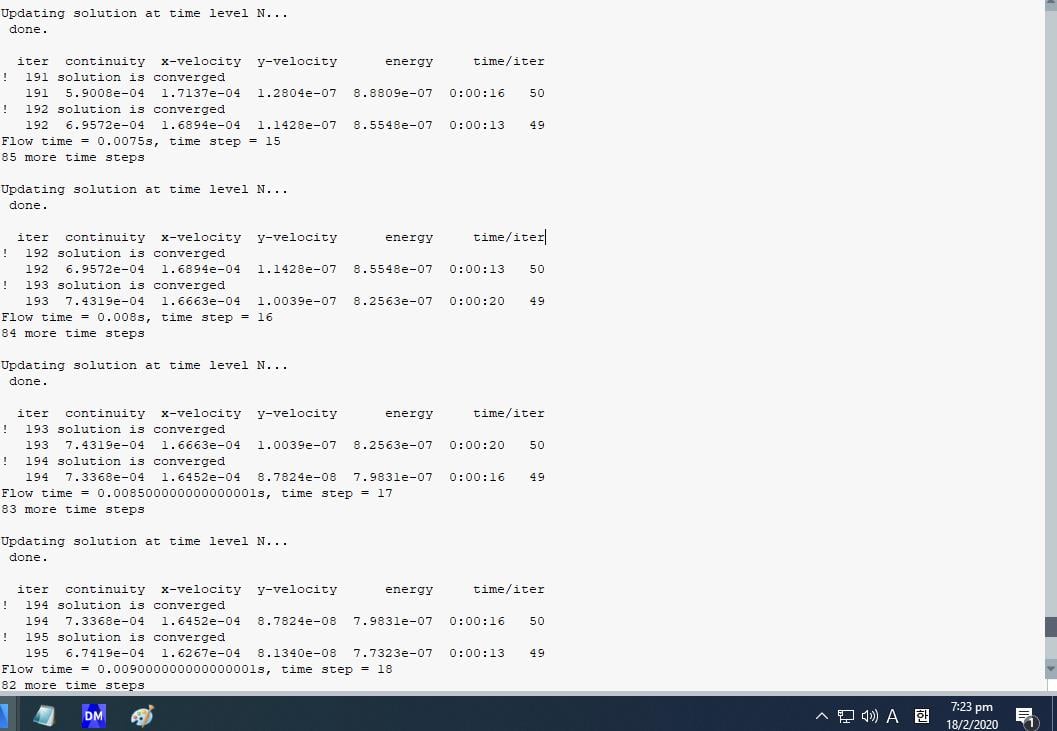
The temperature gradually increases but at around 0.0075 and 0.0085, the red line makes two horizontal lines which represent constant temperature at those two time slots.
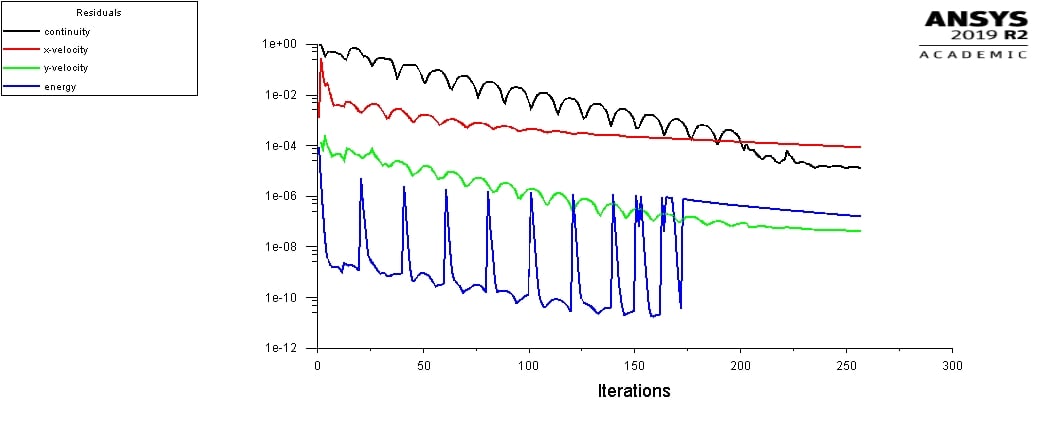
This is my residual plot
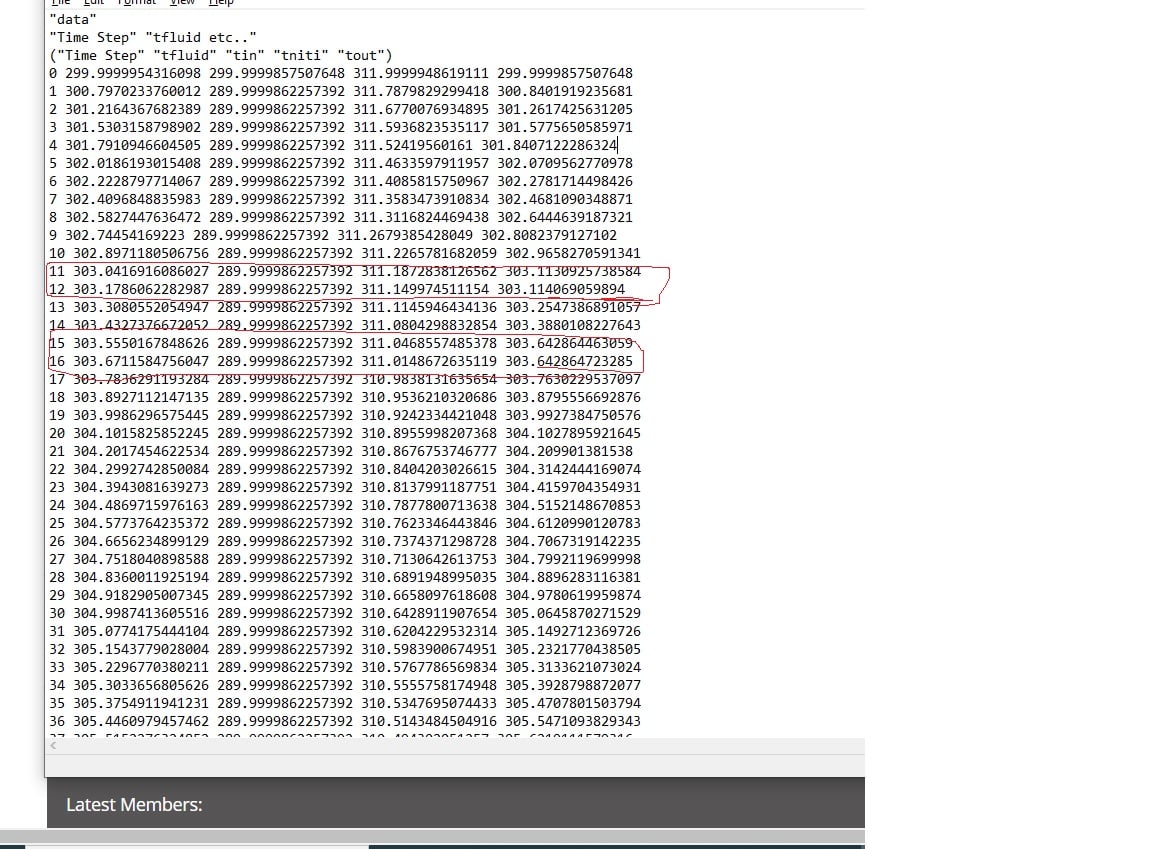
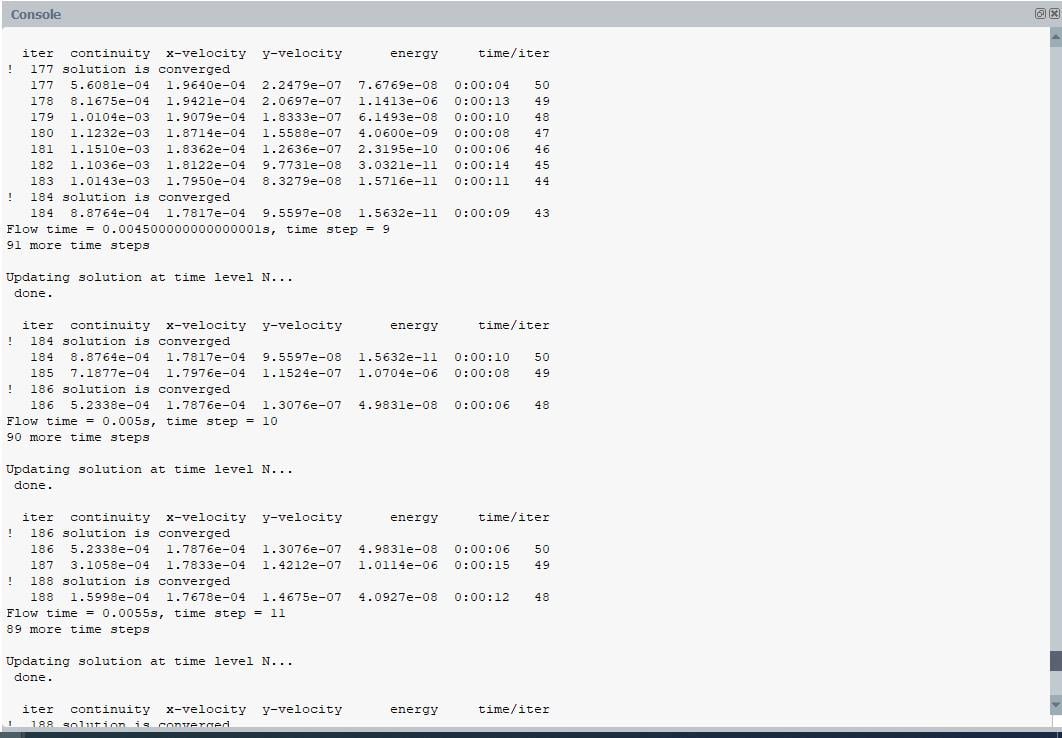
Why does the temperature line does not increase gradually but make two flat sections?. I have looked a the temperature value at the time step where this happens. the values gradually increases but i found for a two time steps the temperature was constant. this is shown as flat section in the plot. Is there anyone who can help with this problem?




















 You are navigating away from the AIS Discovery experience