-
-
January 6, 2025 at 2:17 pm
H1640846343
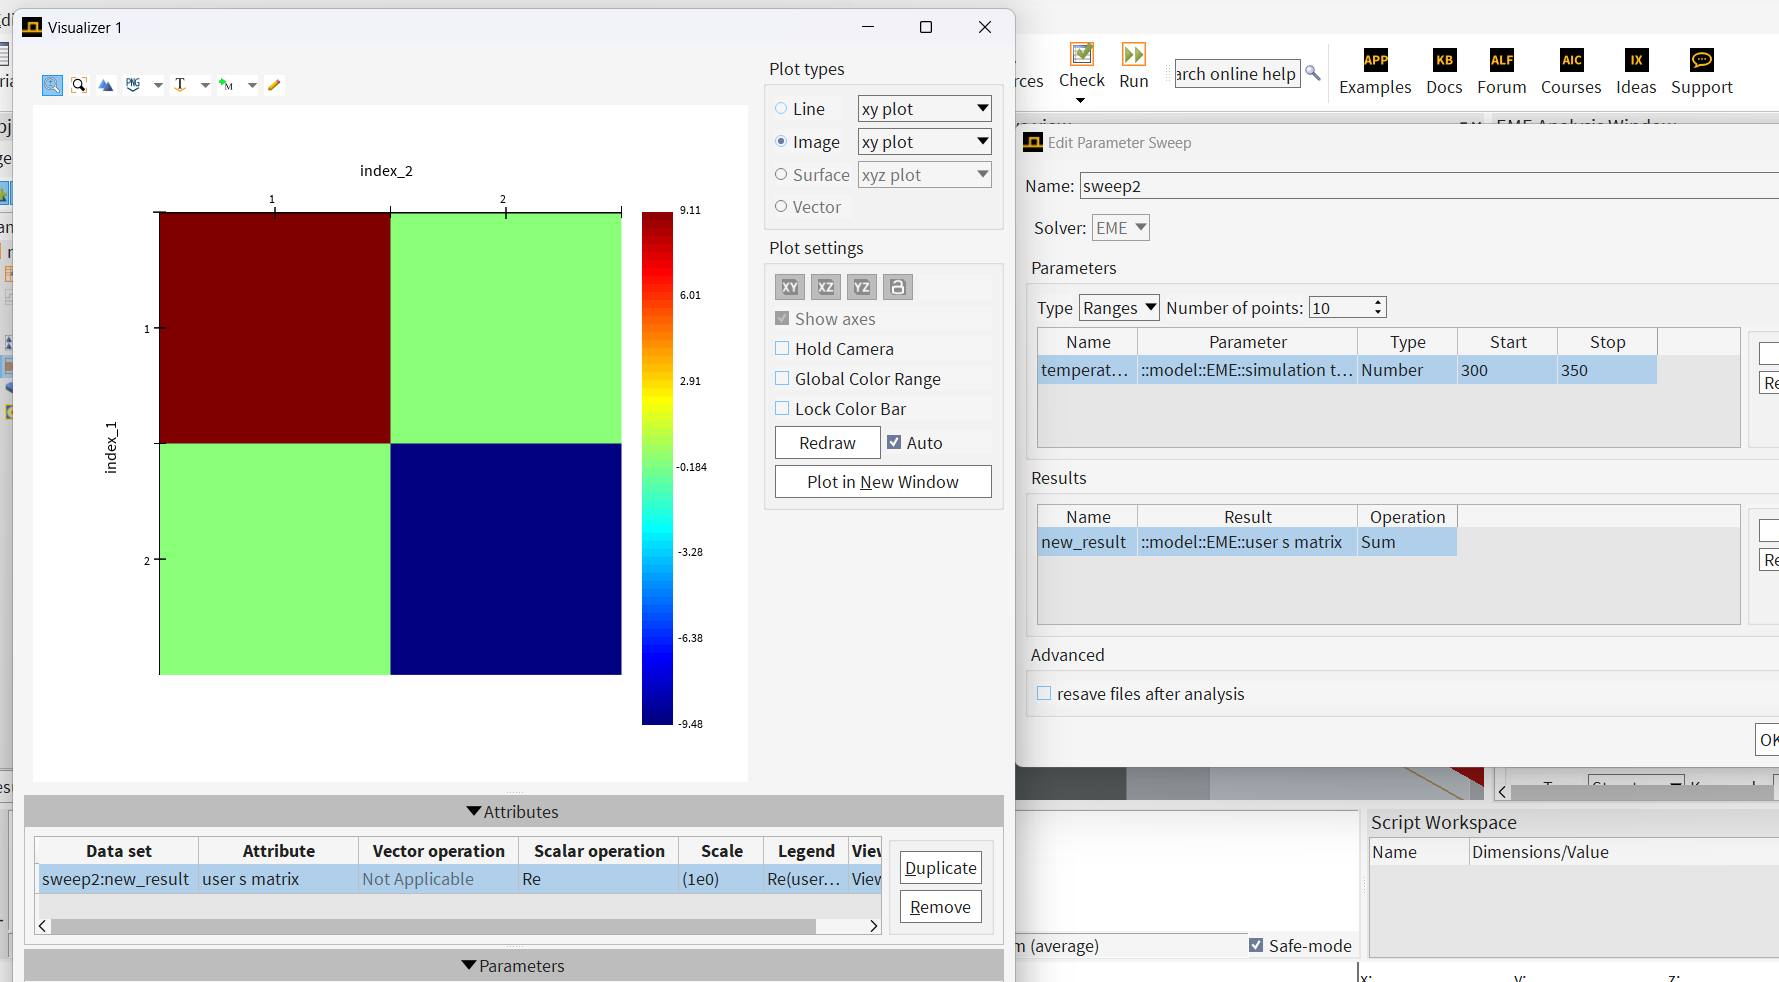
SubscriberEME conducted simulations of a single period of Bragg grating and successfully obtained transmission spectra. I tried scanning the temperature parameters of the EME solver to see if I could observe the relationship between temperature and transmission spectra. But in the options of the scanning result, there is only the image of user a matrix, as shown on the left side of the above picture. I don't understand what this represents? What does this mean? What can be obtained through this matrix? Also, I have a question. Will the temperature change of materials with palik suffix already in the material library affect their refractive index? I hope you can help me answer or tell me where to find relevant content on the official website
-
January 6, 2025 at 5:16 pm
Kirill
Forum ModeratorDear Subscriber,
For EME simulation results, please refer to the following resources: the EME Solver analysis window overview, particularly the S-matrix mapping section, as well as the associated application examples, such as waveguide Bragg gratings and fiber Bragg gratings.
Regarding temperature dependency: unfortunately, no. If the material type is set to 'Sampled 3D Data,' it does not support temperature dependency. You will need to create a custom material with a defined temperature dependency. Please refer to the article Temperature dependent refractive index models for guidance.
Best regards,
Kirill
-
- You must be logged in to reply to this topic.


-
4683
-
1565
-
1386
-
1242
-
1021

© 2025 Copyright ANSYS, Inc. All rights reserved.


