-
-
August 30, 2019 at 8:47 pm
-
August 30, 2019 at 8:57 pm
peteroznewman
SubscriberI don't understand your question. Yes it is possible.
-
August 30, 2019 at 10:30 pm
Clement08
SubscriberSorry for my english.
I would like to draw a graph similar to this one. -
August 31, 2019 at 12:01 am
peteroznewman
SubscriberYou can do a Topology Optimization to create structures like the one you show in the image.
You start with a definition of there you have to hold the part and load the part, and the available space for the part. Then the Topology Optimization will solve for where the material has to remain to support the load.
-
September 3, 2019 at 1:21 pm
Clement08
SubscriberMy question is about the graph above. I have done a Topology Optimization analysis and now, i would like to draw a graph similar to the one above. The classic graph returned by the process is not that smooth and it's not symmetric which seems to be a bit strange.
I guess I need to add a user defined result like the one I'm using (=TOPO) to get the density map but I didn't find any information about that on the Internet.
Thank you for your help !
-
September 3, 2019 at 2:17 pm
peteroznewman
SubscriberThe difference between your result and the image at the top of the discussion is mesh shape and size. Mesh with quad (2D or hex in 3D) elements and use a smaller element size and you will get a solution that is smoother and more symmetric.
-
September 3, 2019 at 2:34 pm
Clement08
Subscriberok thank you for your advice
And do you know if it is possible to draw a graph showing only elements with a density equal to 1 for example ?Â
-
September 3, 2019 at 3:33 pm
peteroznewman
SubscriberClement,
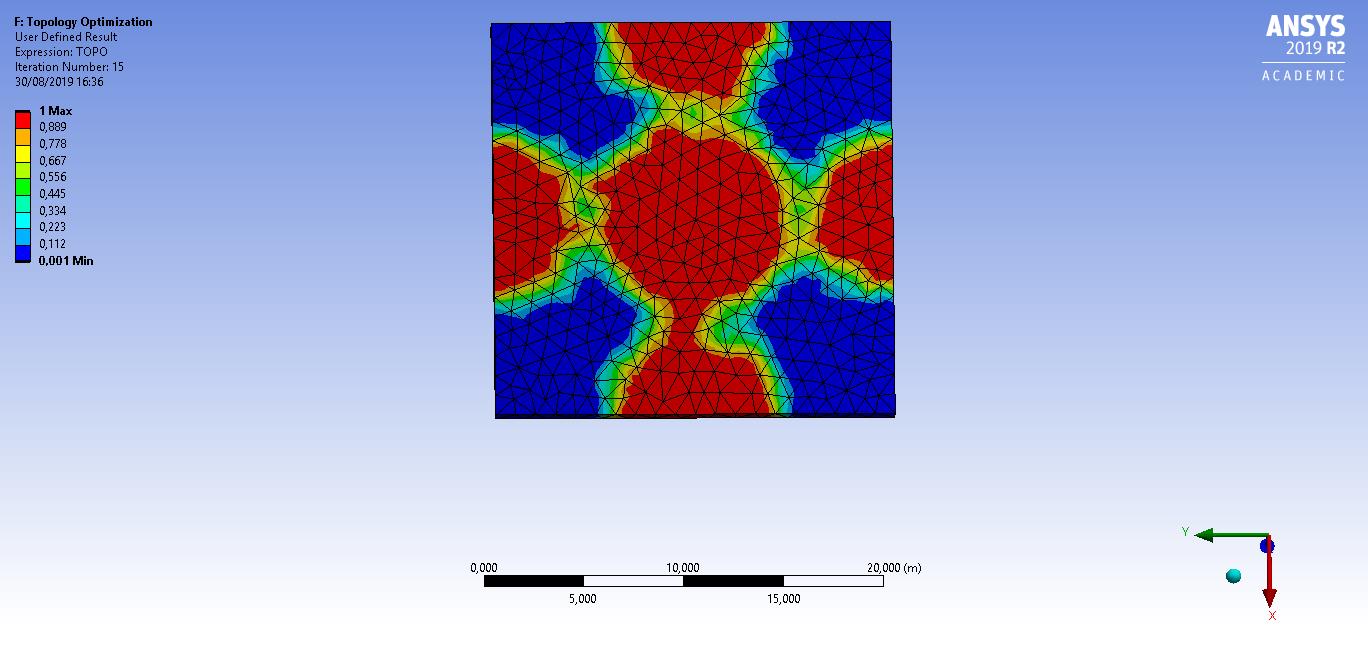
Plotting elements with a density equal to 1 is not useful.
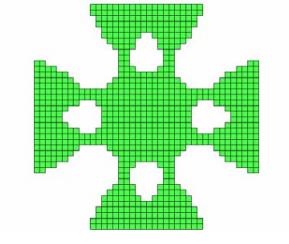
You want to plot elements that have a density greater than 0.6 or 0.8 or any other number.
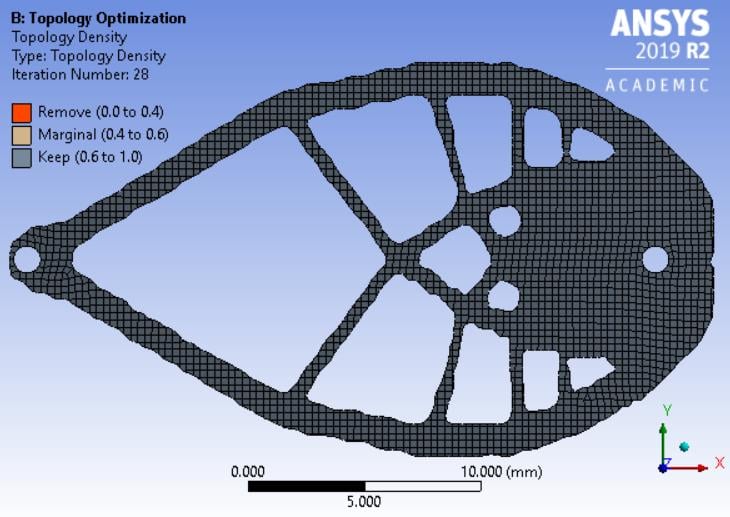
If you plot Topology Density, you get to choose that value based on Nodal Results and that results in a smooth outline.
If you plot Topology Elemental Density, you get to choose that value based on Element Results and that results in complete element outline.
-
September 3, 2019 at 3:55 pm
Clement08
SubscriberOk thanks again for the help !
Last question : what did you do to get your second graph, this is exactly what i want ? Is it a user defined result ?
-
September 3, 2019 at 8:46 pm
peteroznewman
SubscriberThis is one of the standard available results, and is also available as a User Defined Result ETOPO
-
September 4, 2019 at 2:39 pm
Clement08
SubscriberI don't know if I have to open a new discussion about that so if it's the case tell me.
Â
I would like to know a bit more about the topological optimization process. On Ansys website there is no information about what kind of algorithms are used by Ansys to optimize parts. I have seen that the classic algorithm (solid isotropic material with penalization method) can lead to errors when applied to a dynamic case. So do you know where I can find more information about the algorithm used by Ansys to optimize natural frenquencies of a part ?Â
Thank you !
-
- The topic ‘Topology optimization results’ is closed to new replies.
- LPBF Simulation of dissimilar materials in ANSYS mechanical (Thermal Transient)
- Convergence error in modal analysis
- APDL, memory, solid
- Meaning of the error
- How to model a bimodular material in Mechanical
- Simulate a fan on the end of shaft
- Nonlinear load cases combinations
- Real Life Example of a non-symmetric eigenvalue problem
- How can the results of Pressures and Motions for all elements be obtained?
- Contact stiffness too big
-
4327
-
1494
-
1375
-
1197
-
1021
© 2025 Copyright ANSYS, Inc. All rights reserved.


