We have an exciting announcement about badges coming in May 2025. Until then, we will temporarily stop issuing new badges for course completions and certifications. However, all completions will be recorded and fulfilled after May 2025.
LS Dyna

LS Dyna

Topics related to LS-DYNA, Autodyn, Explicit STR and more.

Problems with fatigue calculations

TAGGED: ,

    • javat33489
      Subscriber
      Hi all.
      I've done a fatigue test and have questions.
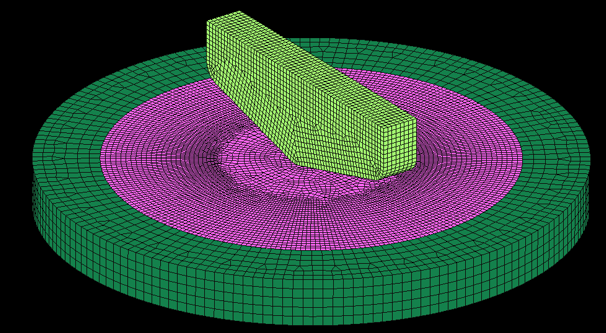
      I model a tungsten carbide drill tip that drills an SPG die, with a ring of solid body around the die for securing. The material of the die and ring is Mora-Columba concrete.
       
       
      The units I use are: GPa, mm, ms.
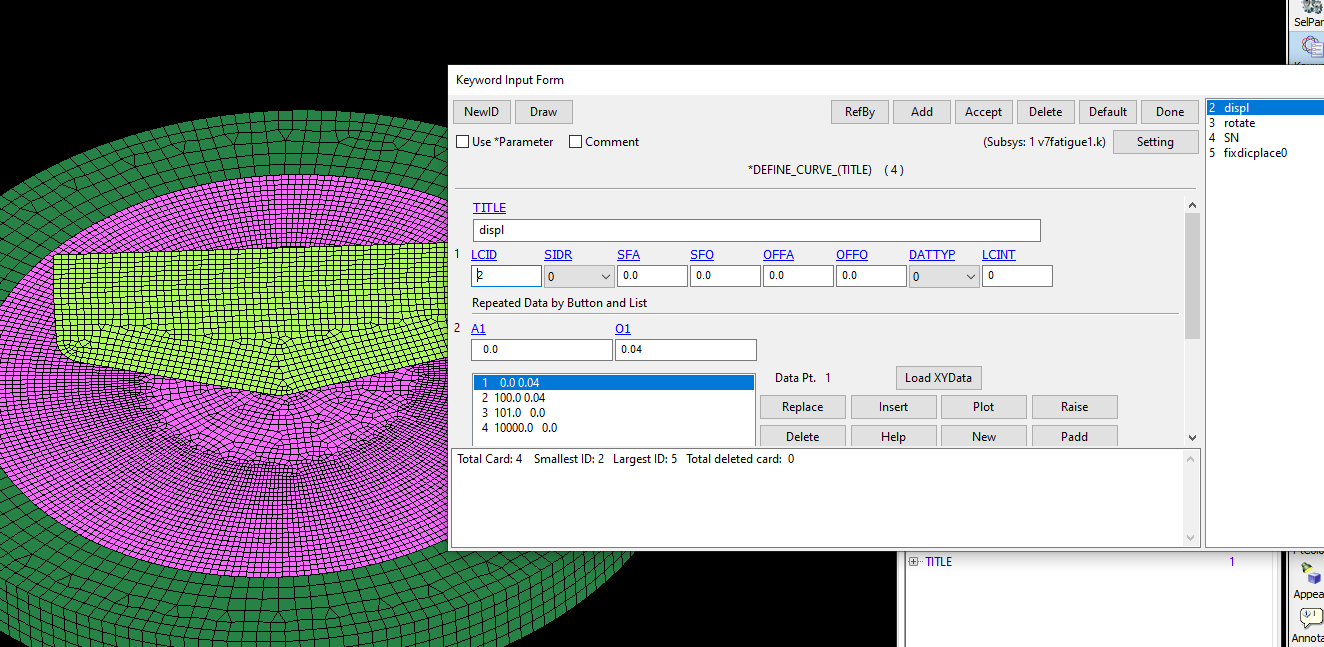
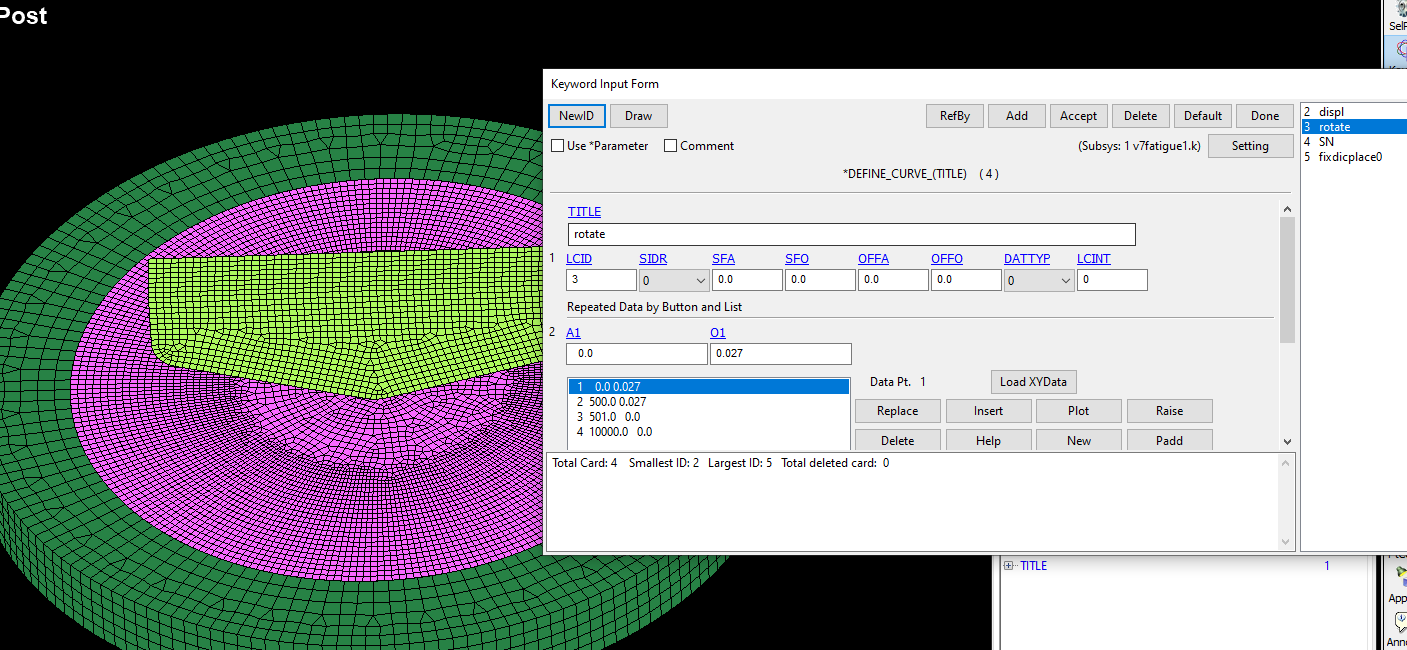
      The rotation of the drill is set at a speed of rad/ms.
       
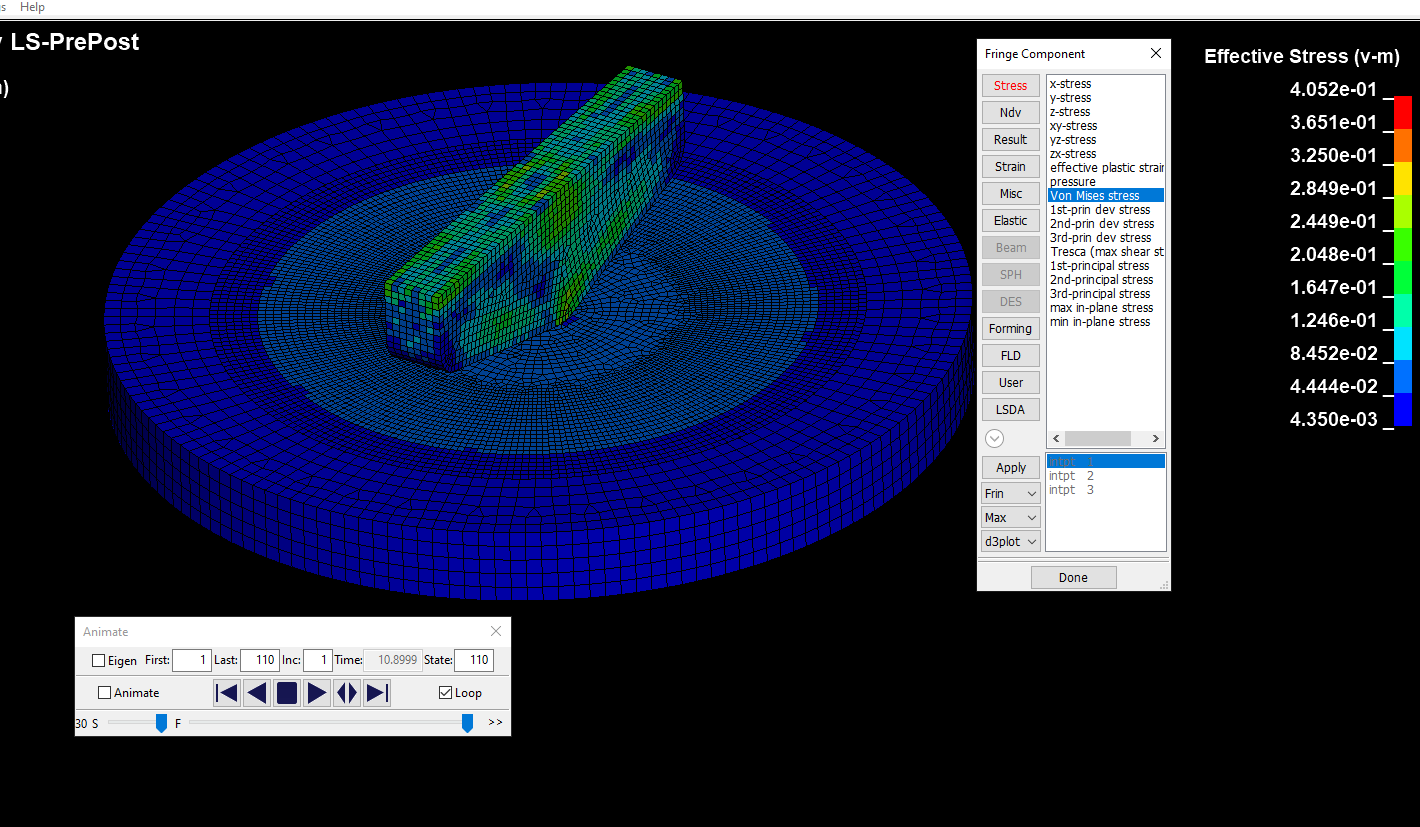
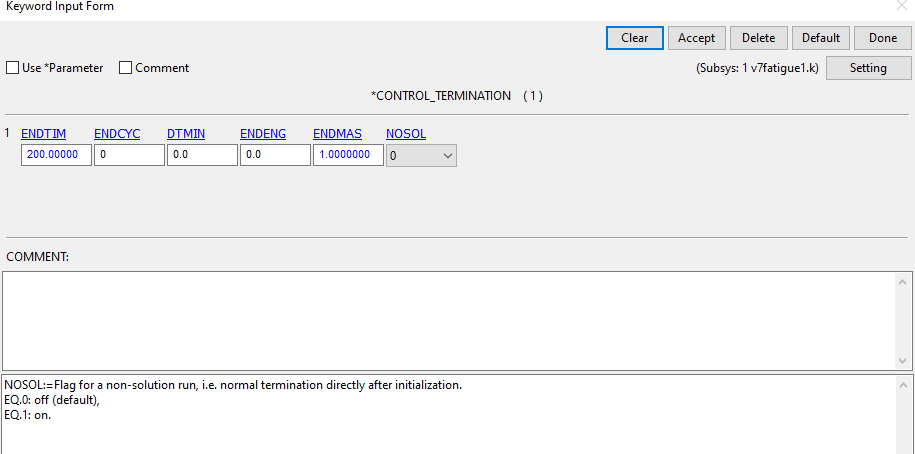
      I did a short calculation (2 hours), the drill rotated about 30 degrees during this time (the total solution to the problem was 60 hours).
      I checked the d3plot file. Adequate stress:
       
      Next, I decided to do a fatigue analysis to check what it would look like.
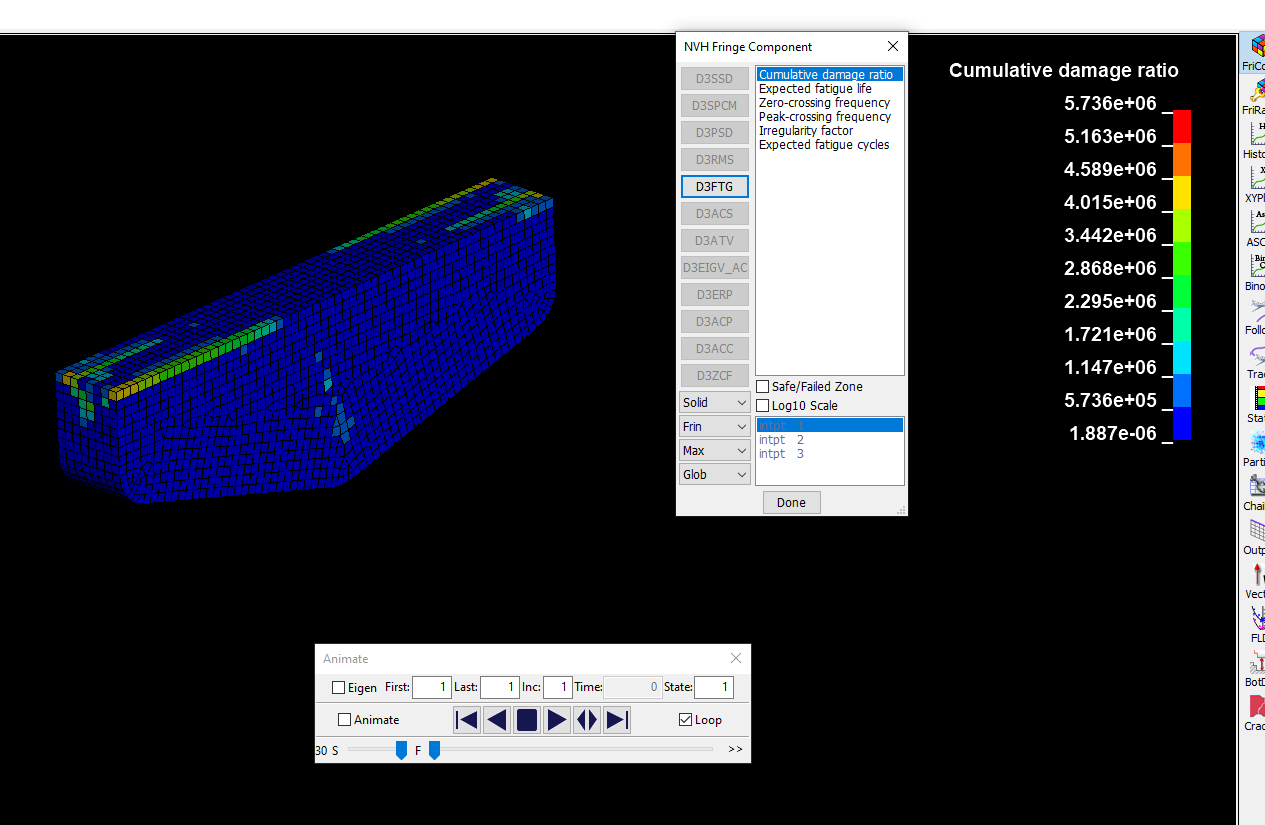
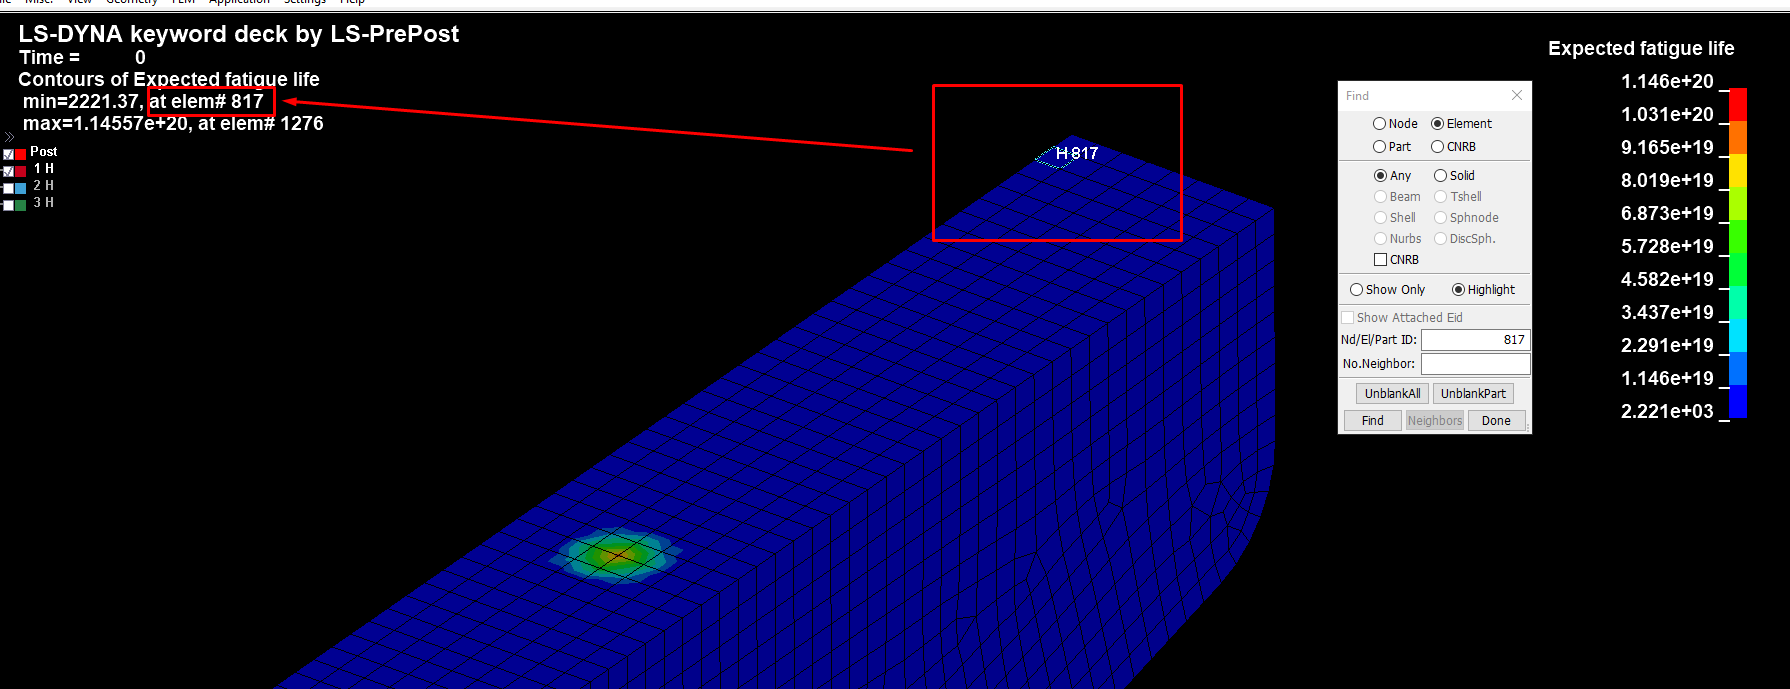
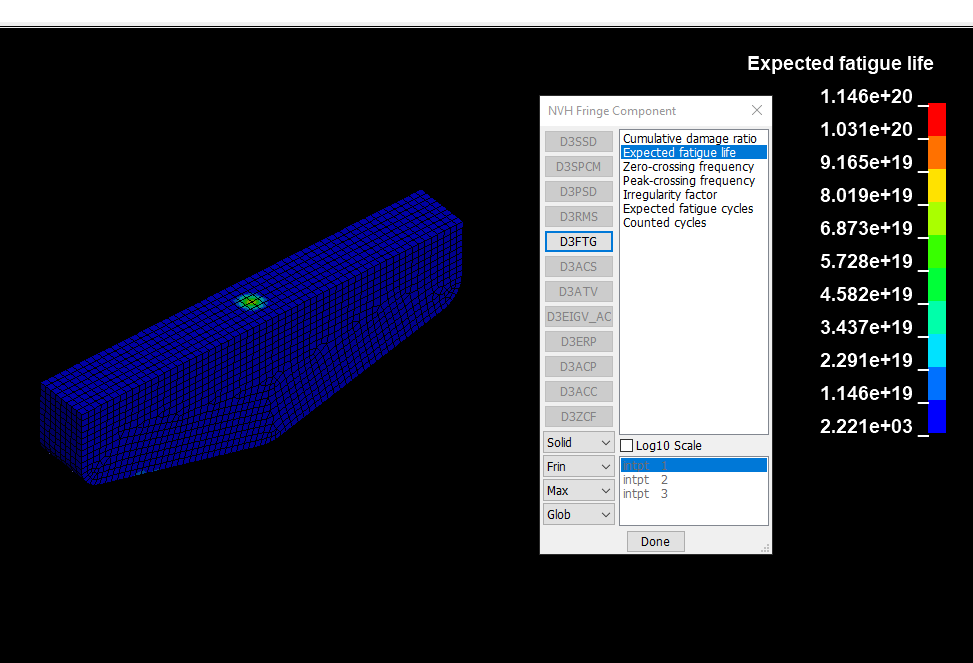
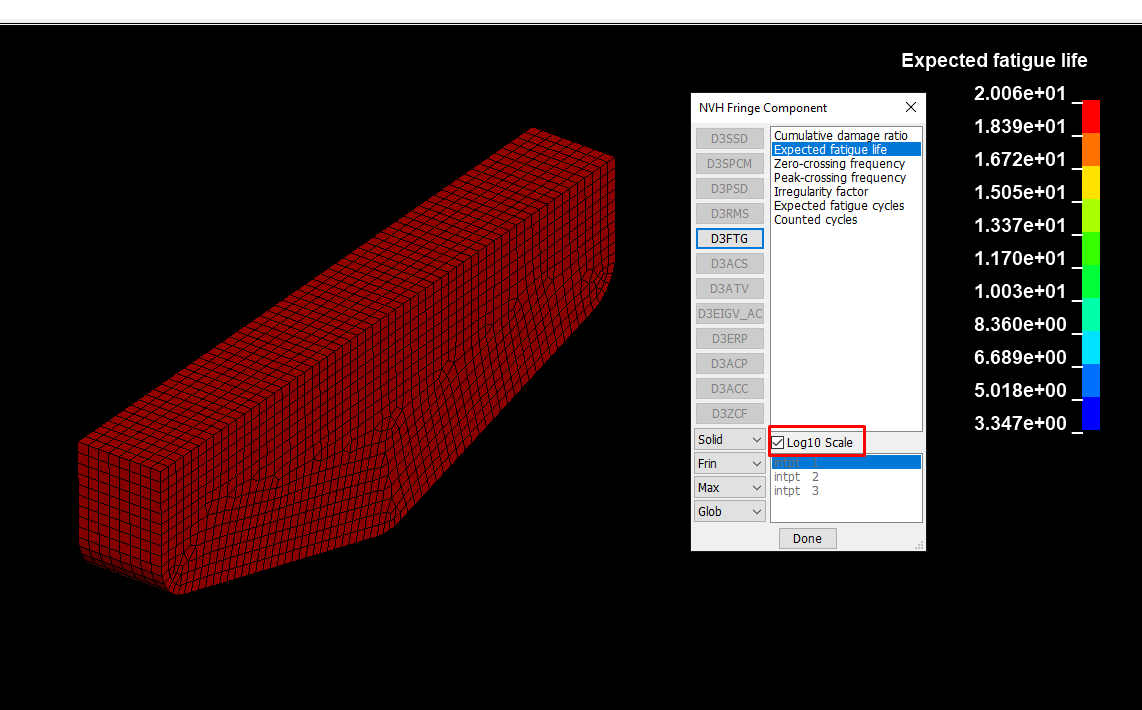
      I got inadequate results:


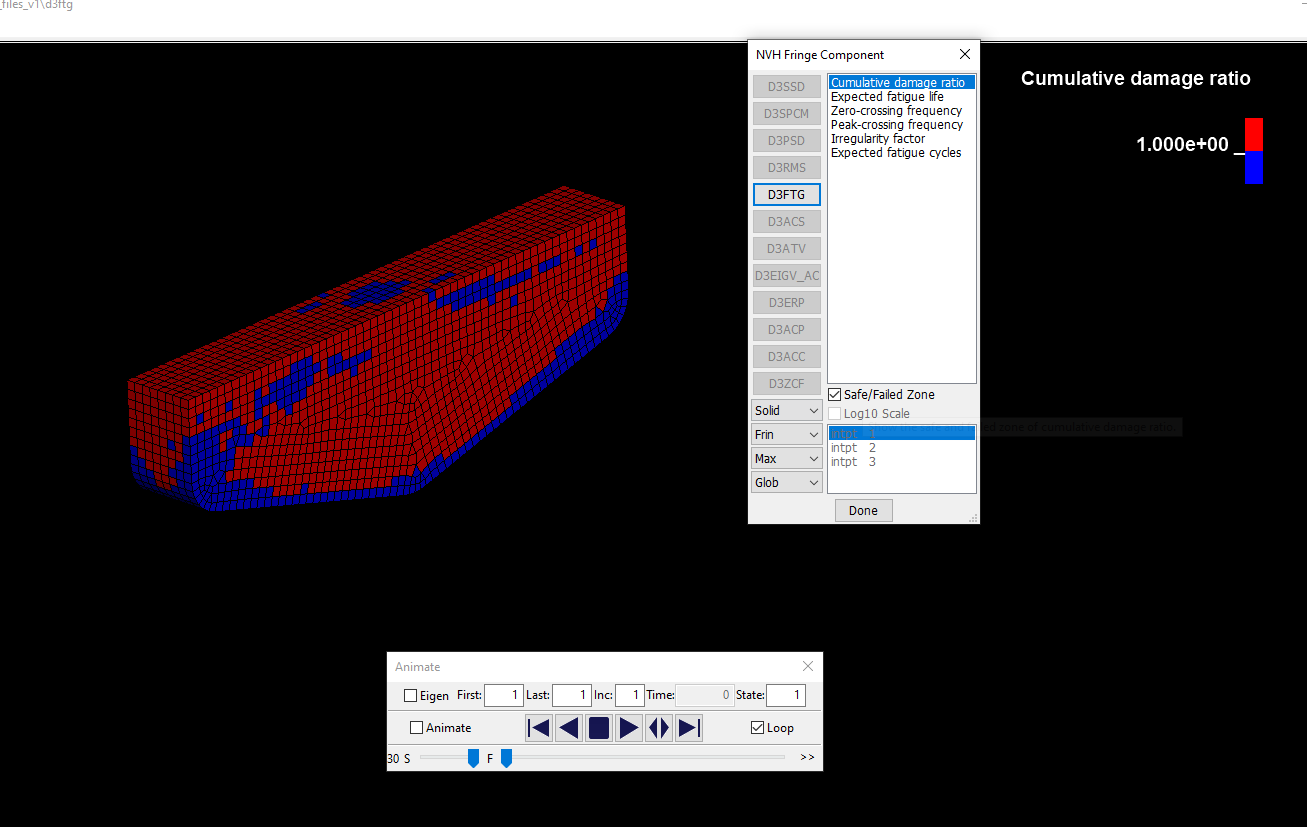
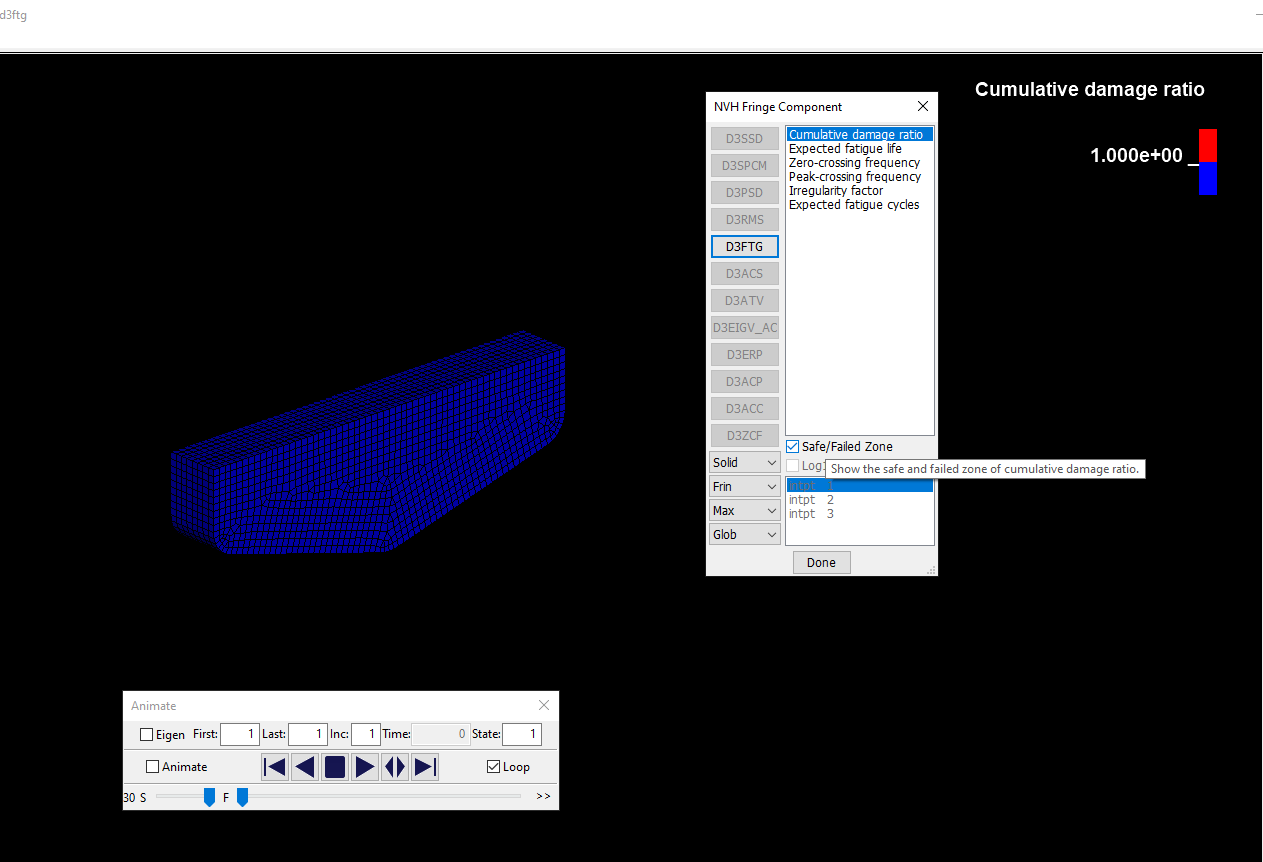
      1. The cumulative damage ratio is too high.
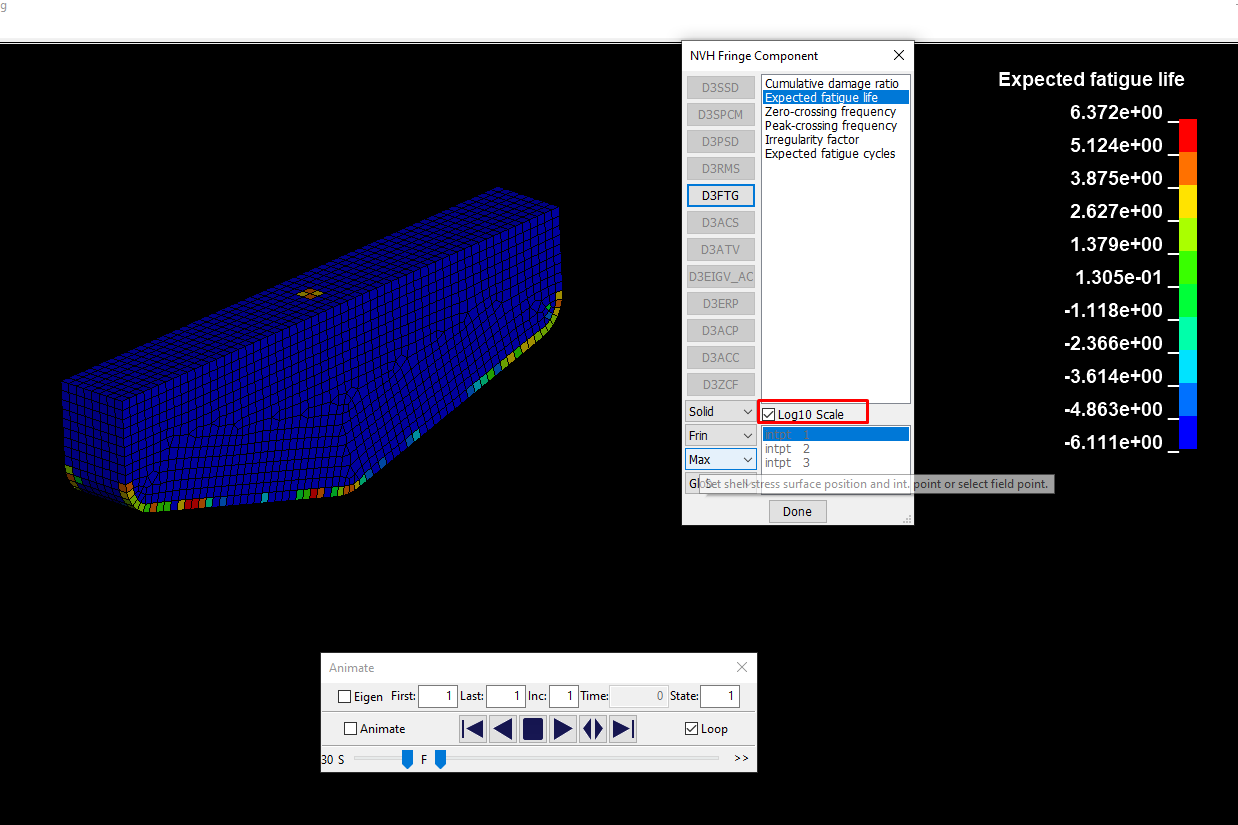
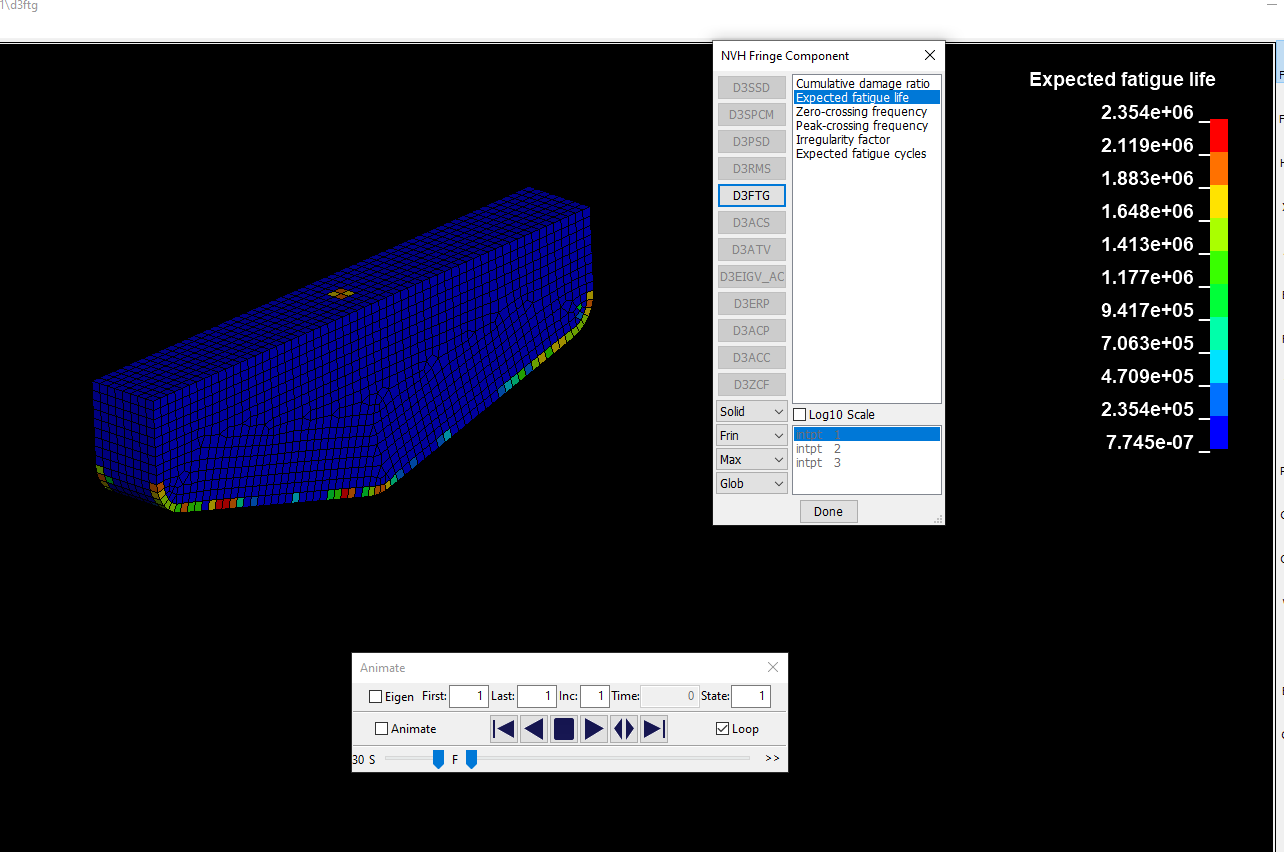
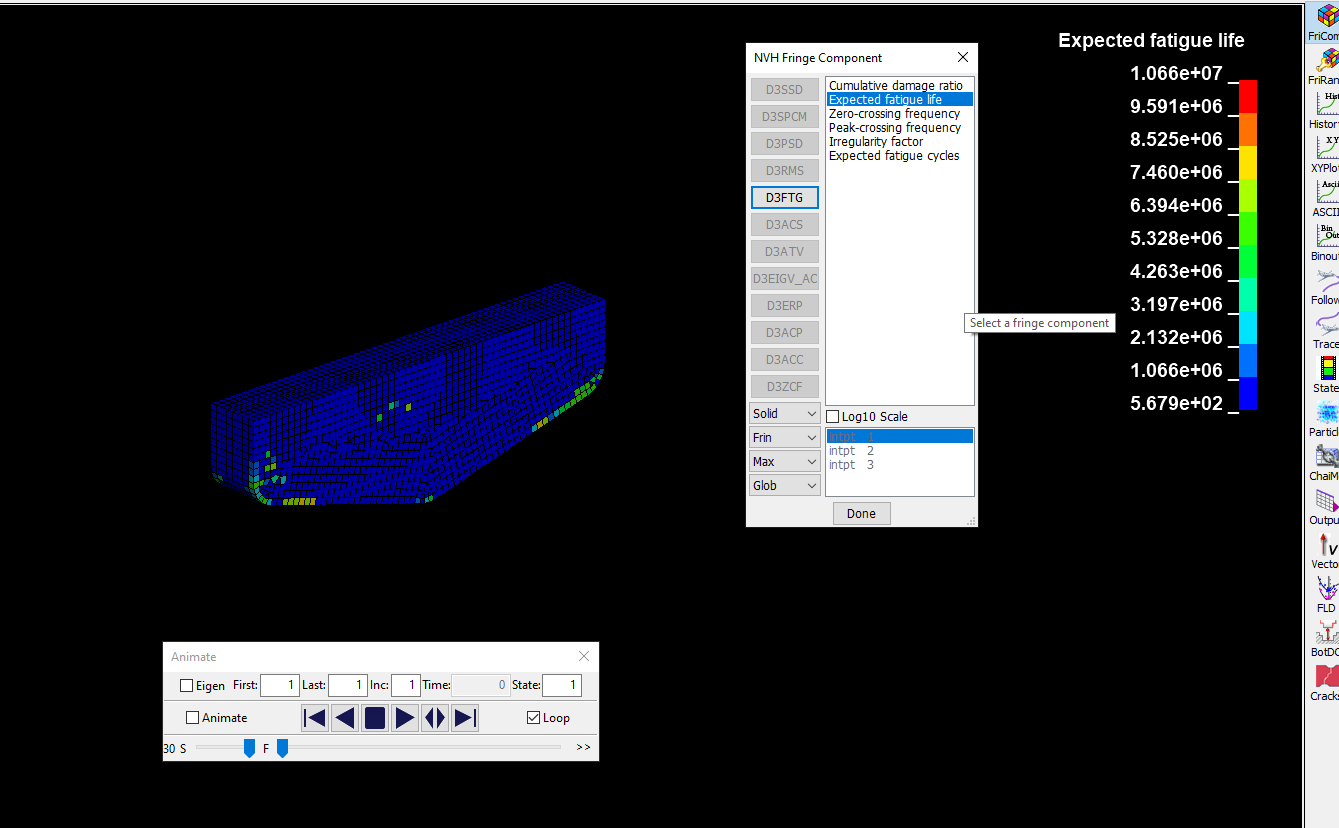
      2. Expected Fatigue Life - too small, the elements will only last 235 seconds under load? But they drill with such a drill for many hours or even the whole day. Tungsten carbide is a very durable material with high density.
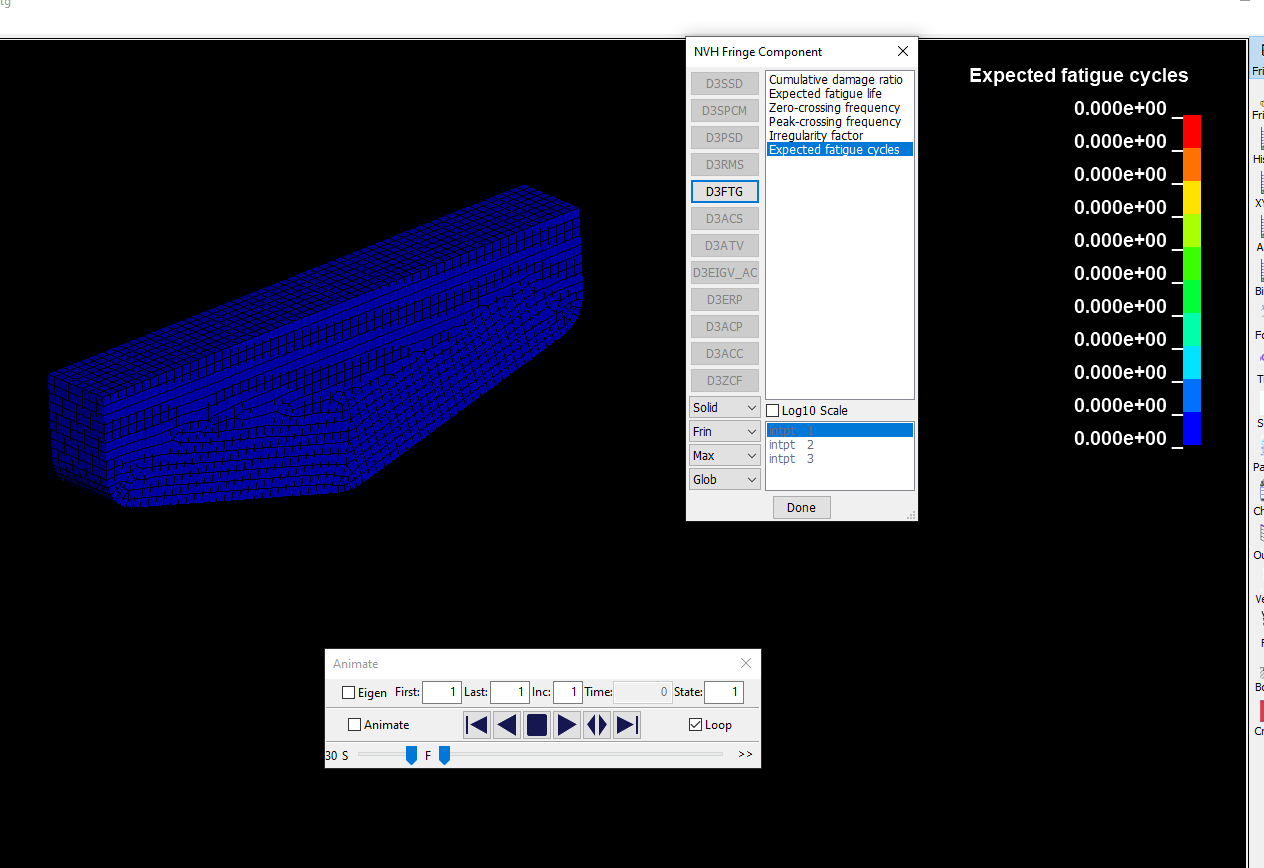
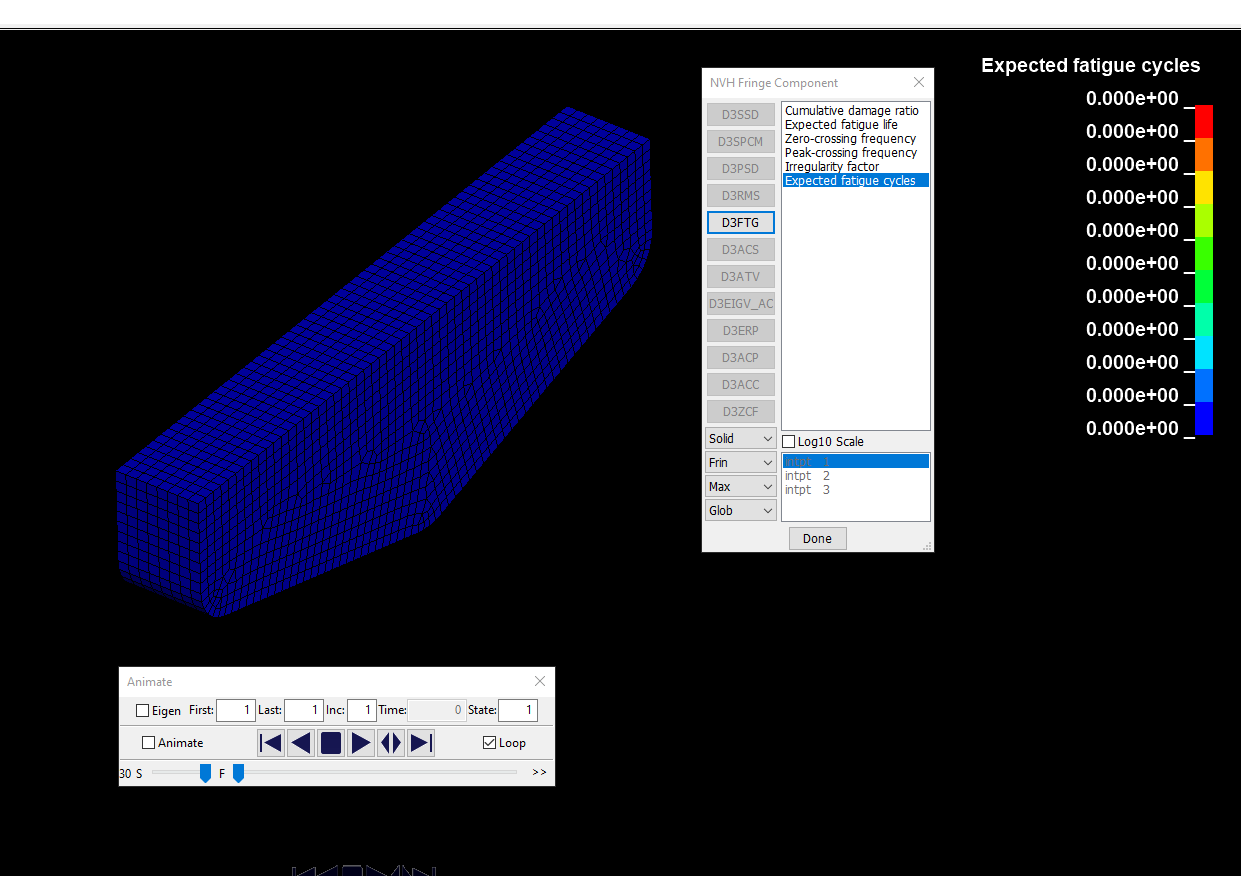
      3. Expected fatigue cycles are generally empty. Why?
      Help me understand the results, what could I have done wrong?
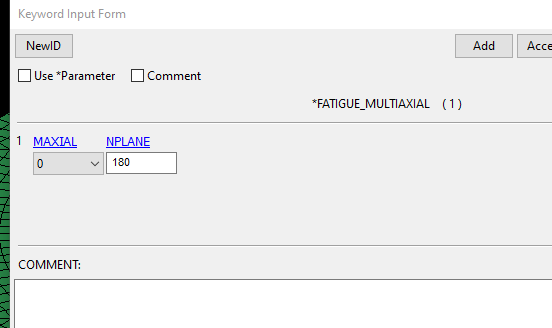
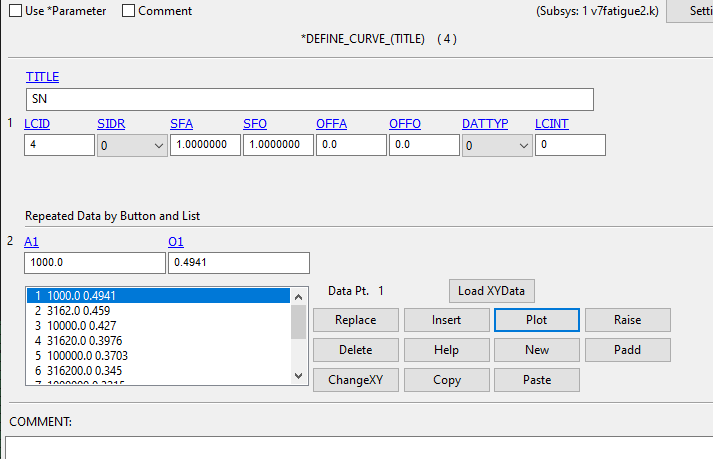
      I also apply some basic fatigue tinctures:
       
      SN curve for drill:
       
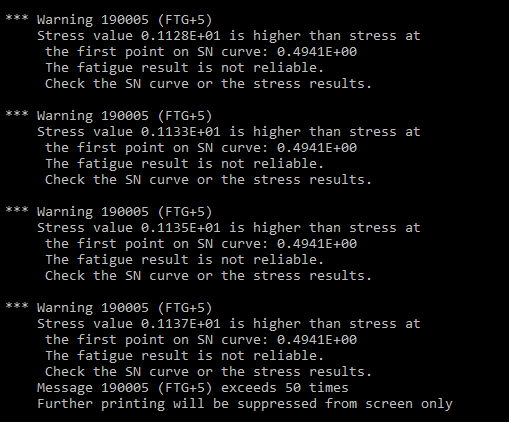
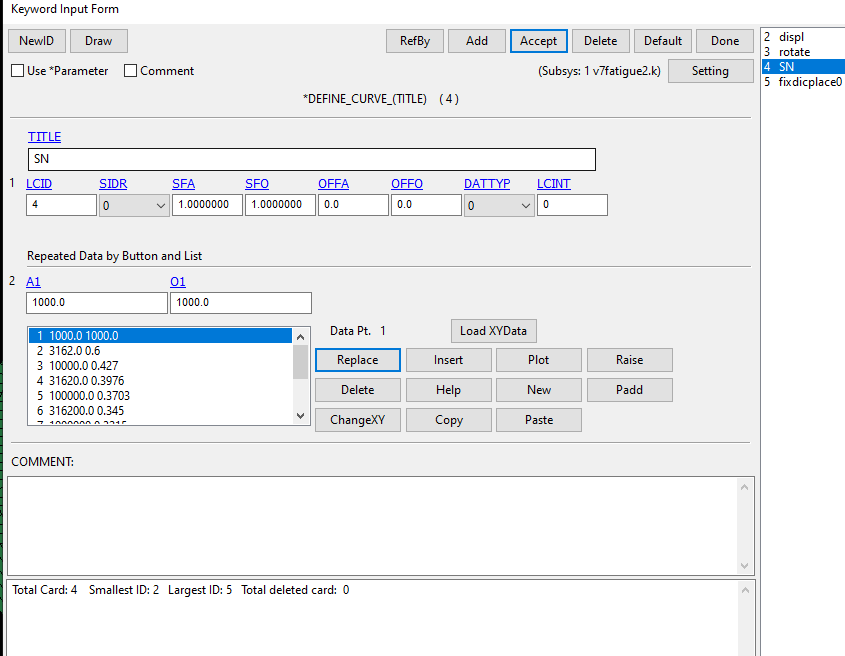
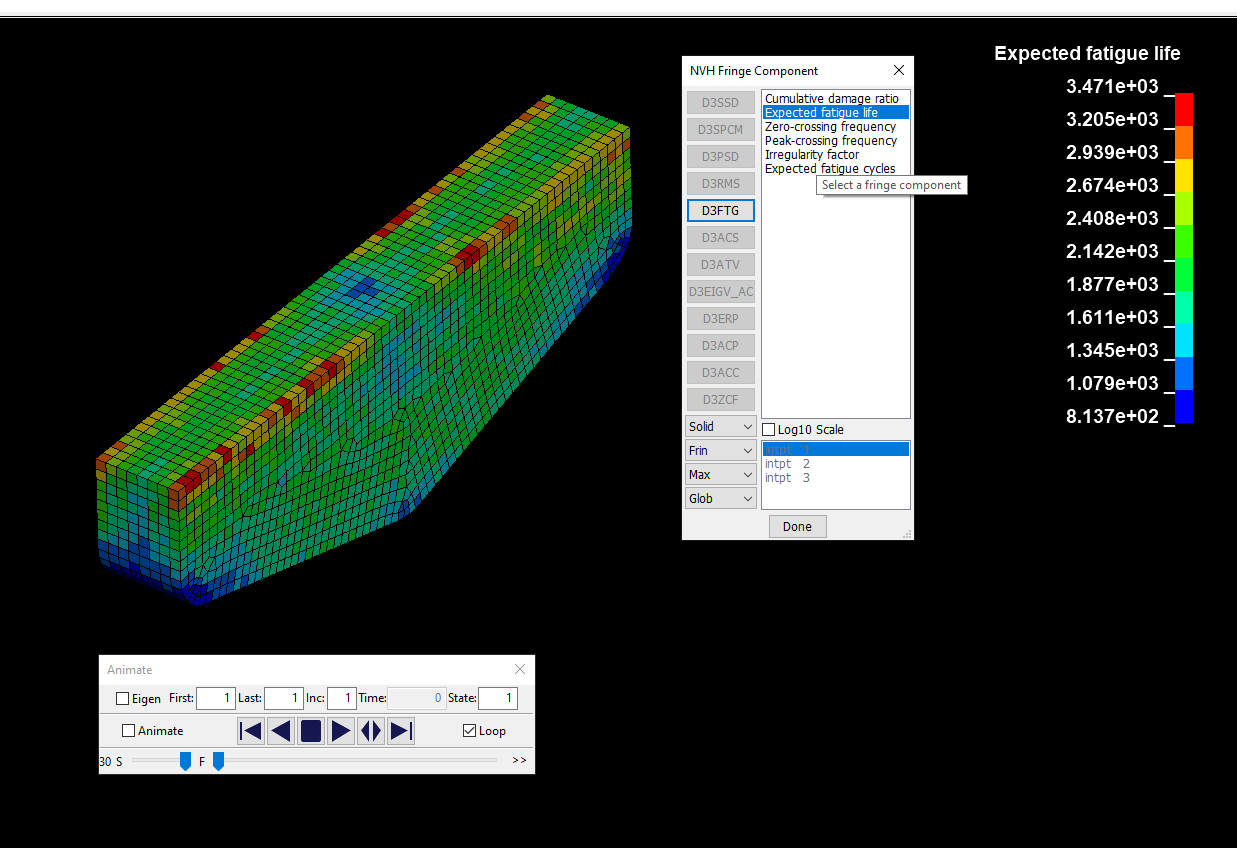
      I also got this warning when I increased the starting point in the SN curve, I got the following results:
       
      The damage has become less, it is gone, but the lifespan is still short.
       
      PS. To reduce calculation time, I increased the density of the die, ring and drill by 4e10, can this make a difference? 
      Please, help. Thank you.
    • javat33489
      Subscriber
      Colleagues.
      I figured out one question regarding "1. The cumulative damage ratio is too high". The problem was in the material, I specified the compressive strength and removed the tangential modulus, because... it is unknown and the value was tested in detail.
       
      But problems 2 and 3 remain:
      2.Expected Fatigue Life - too small.
      3.Expected fatigue cycles are generally empty.


      Why is Expected Fatigue Life so small? Tungsten carbide is a very durable material. Compressive strength 6 GPa. The maximum stress according to calculations (d3plot) is 1 GPa.
      There are no Expected fatigue cycles at all, why? Am I missing something?
      Please, help.
    • javat33489
      Subscriber

      HELP PLEASE

    • javat33489
      Subscriber

      Guys, I decided everything again and transferred it, look, there are no cycles because the life is very small at the very bottom! why is that?

      • igandiko
        Ansys Employee

        Hello, how do the element stress results compare to the S-N curve? Do the elements showing low fatigue life have higher stresses/high damage ratio? 

        The expected fatigue life is computed as exposure time (in time domain, it is defined by termination time by *CONTROL_TERMINATION, also see texpo paramter) divided by cumulative damage ratio.

        Regarding your question 3, expected fatigue cycles are computed as "expected fatigue life" times “zero-crossing frequency with positive slope”. For d3ftg generated in a time domain fatigue analysis, only cumulative damage ratio and expected fatigue life are provided. There is no “zero-crossing frequency” so no “expected fatigue cycle” is provided.

        • javat33489
          Subscriber
          Hello, how do the element stress results compare to the S-N curve? Do the elements showing low fatigue life have higher stresses/high damage ratio?
           
          - Sir, I have modified and simplified the SN curve for the test in this way, from the tensile strength of the material:
           
          Mises stress:
           
           
          *CONTROL_TERMINATION, also see texpo parameter
          - Sir, there is no such parameter
           
           
          Regarding your question 3, expected fatigue cycles are computed as “expected fatigue life” times “zero-crossing frequency with positive slope”. For d3ftg generated in a time domain fatigue analysis, only cumulative damage ratio and expected fatigue life are provided. There is no “zero-crossing frequency” so no “expected fatigue cycle” is provided.
           
          - I understand sir, there will be no cycles. How then can I check the load, for example, for a task I will drill 10 mm, but I need to check the strength at 1000, how can I scale this? what maps or settings?
           
          ___
          PS
           
          Maybe I can upload a K-file here? Can you watch it?
    • javat33489
      Subscriber

      HELP PLEASE!

Viewing 4 reply threads
  • The topic ‘Problems with fatigue calculations’ is closed to new replies.