-
-
January 22, 2024 at 5:52 pm
Rafael Gomes
SubscriberHello everyone!
I'm using the Workbench Autodyn to perform a simulation of a tubular structure using a honeycomb unit cell under compression displacement. I need to plot the graph Force x Displacement. Is it possible to generate this graph using Autodyn? I'm only aware of the stress x strain..Thanks in advance!
-
January 22, 2024 at 7:50 pm
peteroznewman
SubscriberRequest Force Reaction vs Time and also Displacement vs Time. Export Tabular Data from each result and use Excel to plot Force vs Displacement. Or you can insert a Chart object and Plot Force vs Displacement in Mechanical, but trust me, use Excel.
-
January 23, 2024 at 2:14 pm
Rafael Gomes
SubscriberThank you very much for your answer.
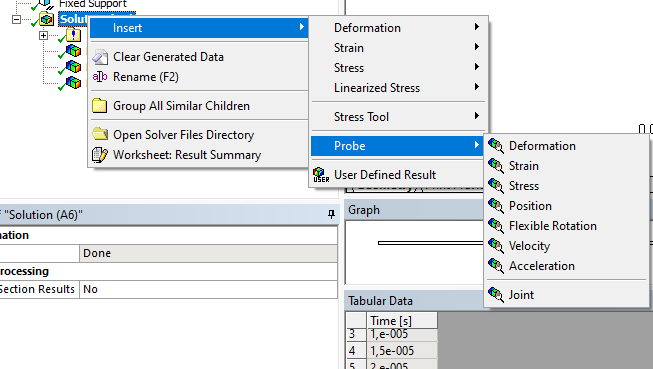
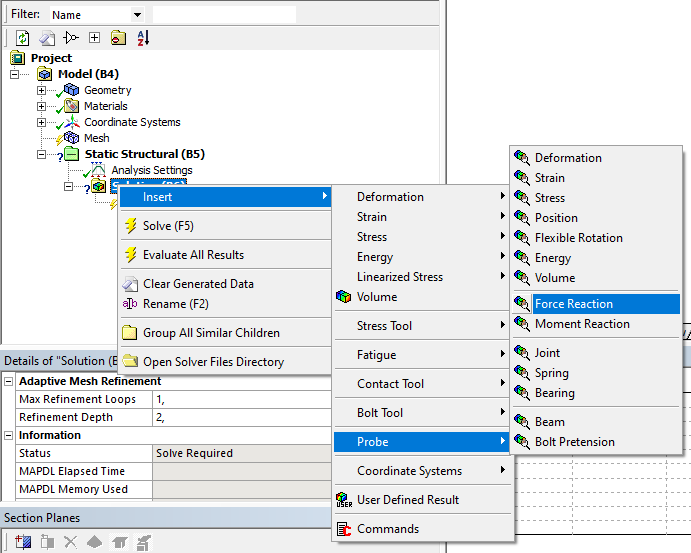
In this case, using Autodyn, it does not give me any option to select the reaction force. I found the force reaction in the “probe” option, but only in the “mechanical” for the static analyses.
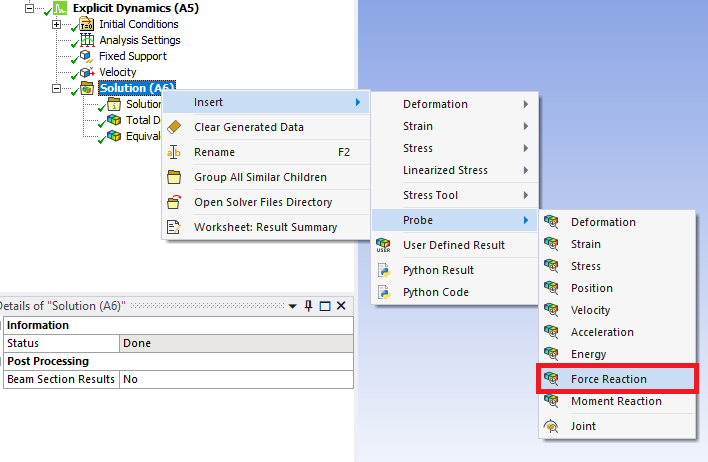
Do you know if it is possible to evaluate the force in explicit dynamics? And posteriorly plot the Force x Displacement?
Thanks in advance! -
January 23, 2024 at 3:18 pm
-
January 23, 2024 at 9:44 pm
peteroznewman
SubscriberUse a Translation Joint to move a rigid body to compress the honeycomb core using a Displacement Load. Then Probe the Joint for the Reaction Force.
-
- The topic ‘Plot Force x Displacement’ is closed to new replies.
-
6029
-
1906
-
1425
-
1308
-
1021
© 2026 Copyright ANSYS, Inc. All rights reserved.


