-
-
January 19, 2024 at 1:29 am
YONGQIAN TANG
SubscriberHello,
I simulated a mode in FDE solver, and calculated the angular farfield of this mode, and then exported it to a .mat file, as the figure show.
Â
Â
Â
Â
 Now i want to plot the farfield data in polar coordinate in matalb, but don't now the code.
Are there any pages or codes i can learn?
Thanks!
-
January 31, 2024 at 7:39 pm
Amrita Pati
Ansys EmployeeHi Yongqian,
Unfortunately, we do not provide support matlab functions. But I believe in MATLAB you would most likely use the surf function to plot something similar. The following links might be helpful: 1. Plotting a Colored Surface in 2D. 2.Polar plotting. I would recommend you to post your question in mathworks community.
Regards,
Amrita-
February 1, 2024 at 9:42 am
YONGQIAN TANG
SubscriberThanks a lot!
-
-
Viewing 1 reply thread
- The topic ‘
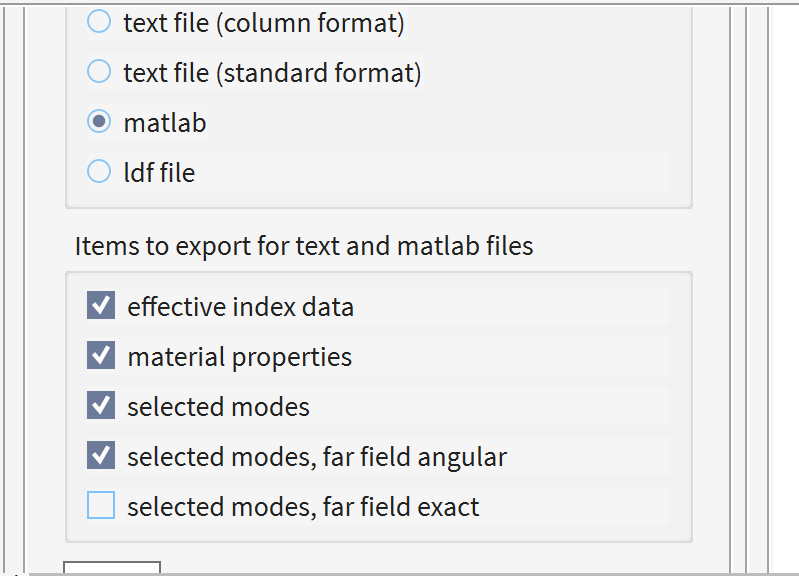
How to plot the angular farfield in matlab of a mode calculated by fde?’ is closed to new replies.
Ansys Innovation Space
Trending discussions
Top Contributors
-
3190
-
1024
-
962
-
858
-
798
Top Rated Tags
© 2025 Copyright ANSYS, Inc. All rights reserved.
Ansys does not support the usage of unauthorized Ansys software. Please visit www.ansys.com to obtain an official distribution.