TAGGED: charge
-
-
December 4, 2023 at 5:58 am
handon
SubscriberHello,
I'm now on simulation of silicon solar cell's optical and electrical behavior.
I modified the below example and successfully get the Jsc, Voc, FF, PCE.
Planar silicon solar cell – Ansys Optics
However, in that example, the exported optical generation rate data is based on geometric like "G vs x, y, z".
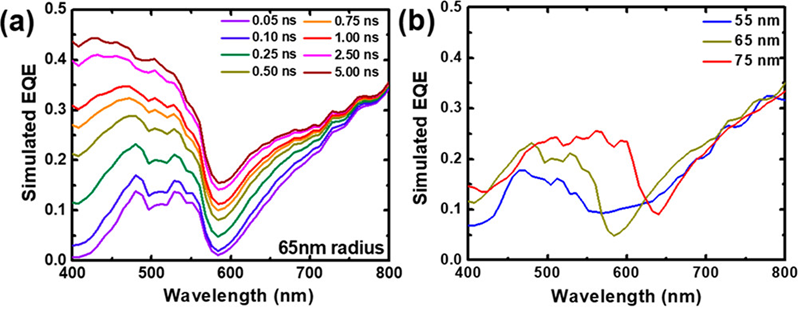
I need a spectral optical generation rate to calculate EQE(external quantum efficiency) like below graph, but it's hard work for me.
Can you let me know how to get the optical generation rate according to wavelength?
Or is there any script example to extract data from FDTD and calculate EQE?
-
December 8, 2023 at 10:01 pm
kghaffari
Ansys EmployeeHi, this is a good question. In short, I think obtaining EQE vs wavelength shold be possible but will need some edits to be applied to the original online example.
EQE is dependent on both Optical Efficiency (OE) calculated in FDTD and Internal Quantum Efficiency (IQE), reported by CHARGE. Respectively, you would need to update these two variables so that you obtain EQE vs wavelength:
A) FDTD will need to generate "g" for each wavelength for CHARGE to use later. The FDTD simulation is already simulating for broadband input. In the “solar_generation” analysis group the calculated generation is integrated over wavelength before being exported to CHARGE. Therefore you can either edit the script to report the generation before it’s integrated; this should report “g” for the bandwidth. Or you may decide to run multiple single frequency simulation without editing the script.
B) CHARGE is run for a single input generation at a time (which needs to have the format of G vs x,y,z). So you will have to run as many frequency points (or g data) made available by FDTD.
-
December 12, 2023 at 11:51 am
handon
SubscriberHi, khashayar. Thanks for your reply.
I succeeded in getting spectral optical generated carriers from FDTD.
For the next step, I need to generate photocurrent at each wavelength point to obtain spectral EQE.I think this would be the B) that you commented on before.
But, I didn't understand well for the variable B. Can you explain more details about that?
Should I edit some script in CHARGE?
-
December 12, 2023 at 6:07 pm
kghaffari
Ansys EmployeeHi,
It's great to see your progress here. B is just the second point focusing on the CHARGE simulation: You can run 1 simulation for a generation data at a time. So if you need EQE vs spectrum you need to run a single CHARGE simulation for each wavelength (or a small wavelength window e.g. 850 - 870 nm). If you repeat this for neighboring wavelength ranges you'll eventually have your IQE response. Combined with your OE from FDTD you should be able to get EQE vs spectrum.
Here, you can try changing the wavelength of your FDTD simulation to narrowband (e.g. 850 - 870nm). The generated optical data and CHARGE simulation results will be for this wavelength.
Hope this helps. Best
-
January 25, 2024 at 2:46 pm
Arpan
SubscriberHello Handon, Khasayar. Can you please confirm i) if EQE is the product of OE (FDTD) and IQE (Charge)? ii) what is the fundamental significance of the efficiency calculated in “planar solar cell” example compared to the IQE and EQE? iii) In the last comment, Khasayar suggested dividing the broadband spectrum into multiple narrowband spectra and perform the calculation. For the sake of improved accuracy, should the narrowband section be overlapping or non overlapping? (By overlapping I mean that the sections be like 850-870, 860-880 nm etc. and during plotting EQE representing each section by their mean) -
January 26, 2024 at 7:09 pm
kghaffari
Ansys EmployeeHi Arpan,
This is a very good question and helps clarify some of the terms used in previous posts here:
In the solar cell example we calculate photovoltaic efficiency; this is done by dividing the generated power ("P") by input power ("Psolar"). This is including the calculated current in CHARGE since P = J (current flux) x Voc.
On the other hand, in an article like our CMOS example here the output of interest is external quantum efficiency which is based on the collection/absorption ratios:
The original question here is regarding EQE for solar cell example; I assume then that the output of interest is related to carriers and not power. In any case, both types of efficiencies rely on the optical efficiency calculated in FDTD, and collection efficiency calculated in CHARGE. Aside from our published examples, I've seen different definitions of efficiency for optoelectronic devices across published works so the terminologies can be confusing.
If efficiency (photovoltaic or external) is needed vs wavelength, multiple CHARGE simulations are needed since one generation input is used in each run. I am not sure about the best approach to separate wavelengths; I would separate wavelengths without overlap unless you have more information about how the overlapping can be helpful e.g. increase accuracy.
Hope this answers all 3 of your questions.
Best regards
-
January 26, 2024 at 9:47 pm
Arpan
SubscriberThanks a lot for the detailed explanation, Khasayar. You reply helped me grasp these concepts more clearly.
I have a confusion regarding the optical efficiency part. In case of Solar cell, is the calculated absorbance (either with the help of reflection and transmission monitor using [1-R-T] or with the help of advanced absorption analysis group) is the optical efficiency?
-
January 29, 2024 at 6:08 am
handon
SubscriberHello, khashayar. It's been a long time.
Your replies were helpful for me and I have tested a lot of simulations.
Here's a new question with my latest progress.---------------------------------------------------------------------------------------------------------
I have a question about running CHARGE simulation with scripts.
My final goal in this simulation is plotting spectral EQE at 300~1100 nm wavelength range.
I’m now testing my simulation including script file at 300 ~ 305 nm.
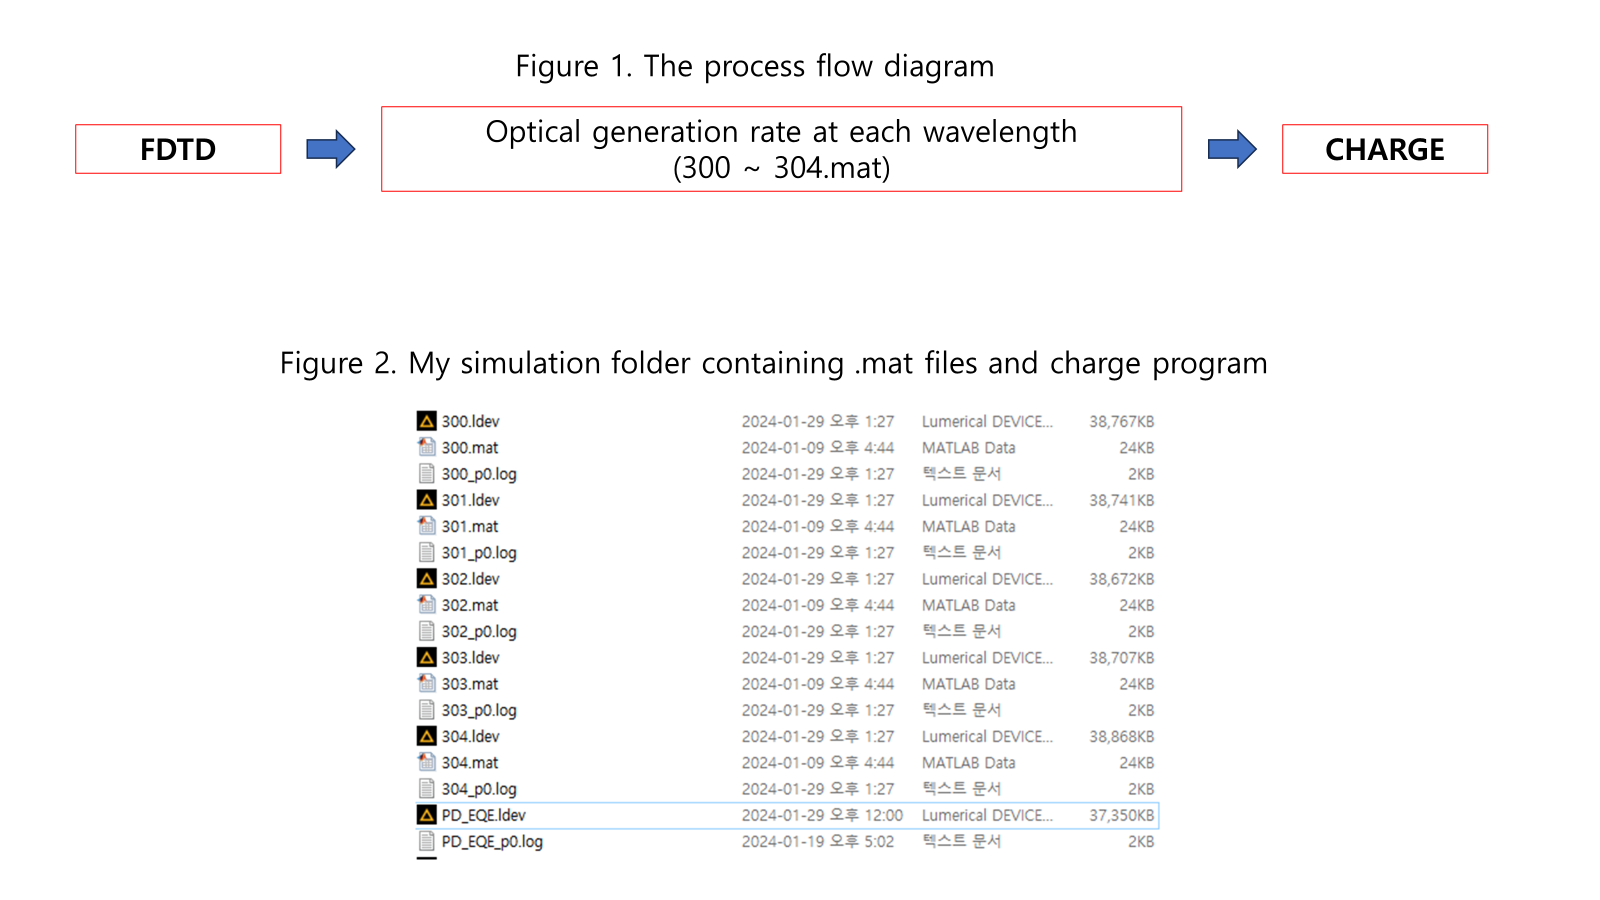
The process to plot spectral EQE is as follows (Figure 1):
At first, I run the FDTD and generate .mat files that contain optical generation rate (G vs. x, y, z) at each single wavelength. (It was conducted by the script of analysis group in FDTD.)
Now, these .mat files (300 ~ 304.mat) are ready to import from script in CHARGE. (Figure 2)
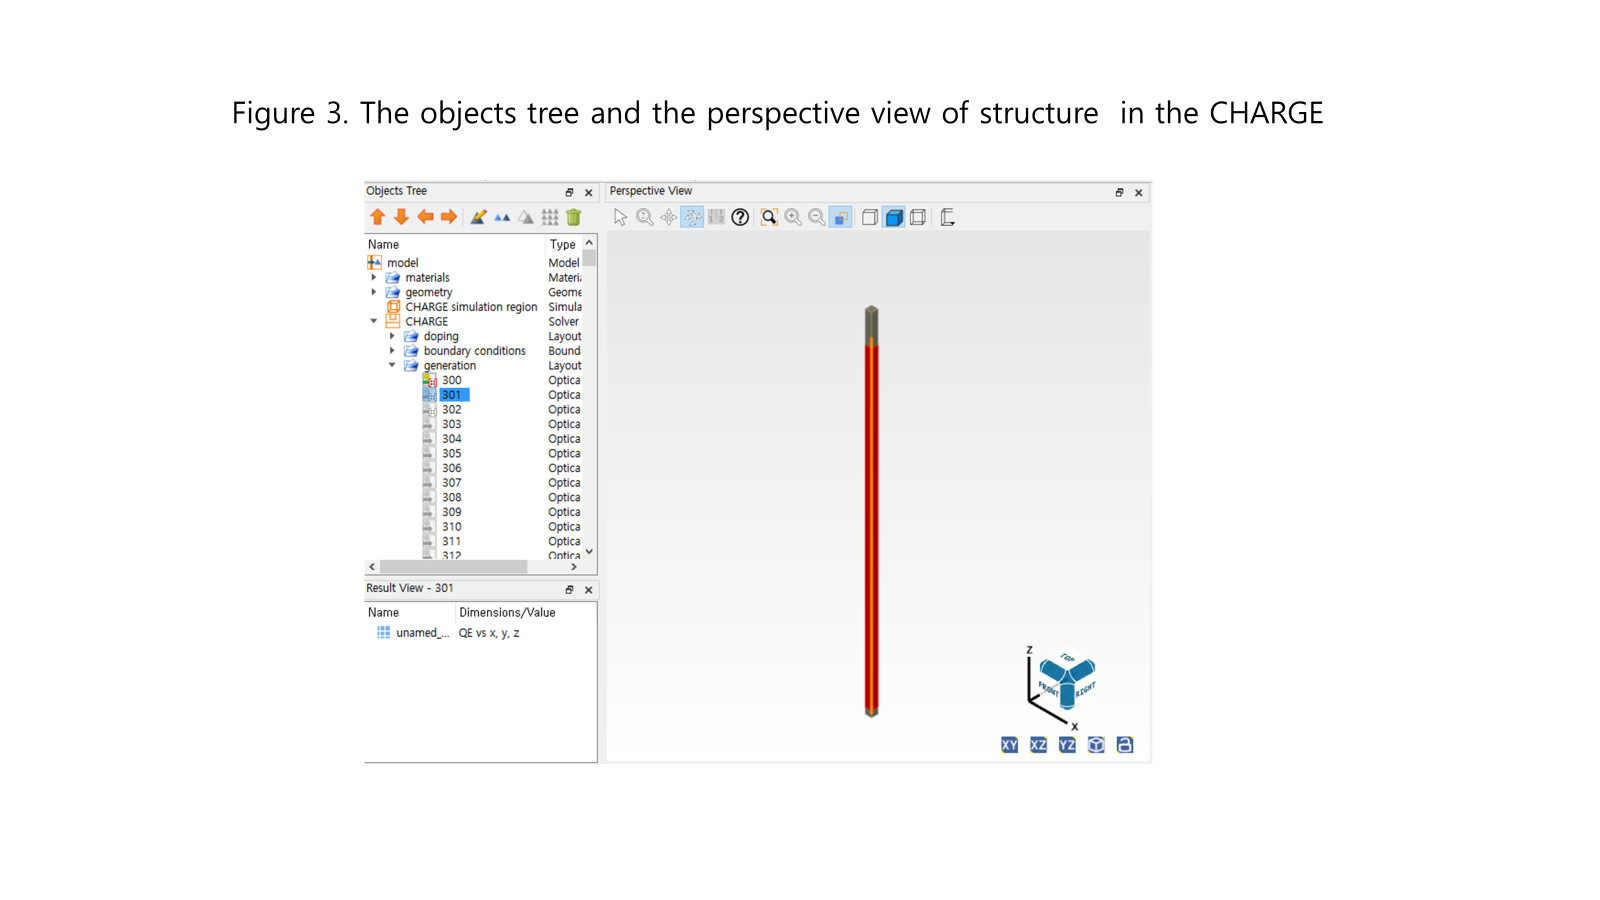
In CHARGE, there is a generation folder that has optical generation imports named with 300 ~ 1100. (Figure 3)
Run the script and get result.
The script file is modified from cis_QE.lsf in the below example:
CMOS - Cross talk and QE extraction – Ansys Optics
However, there are some problems in the CHARGE step of process.
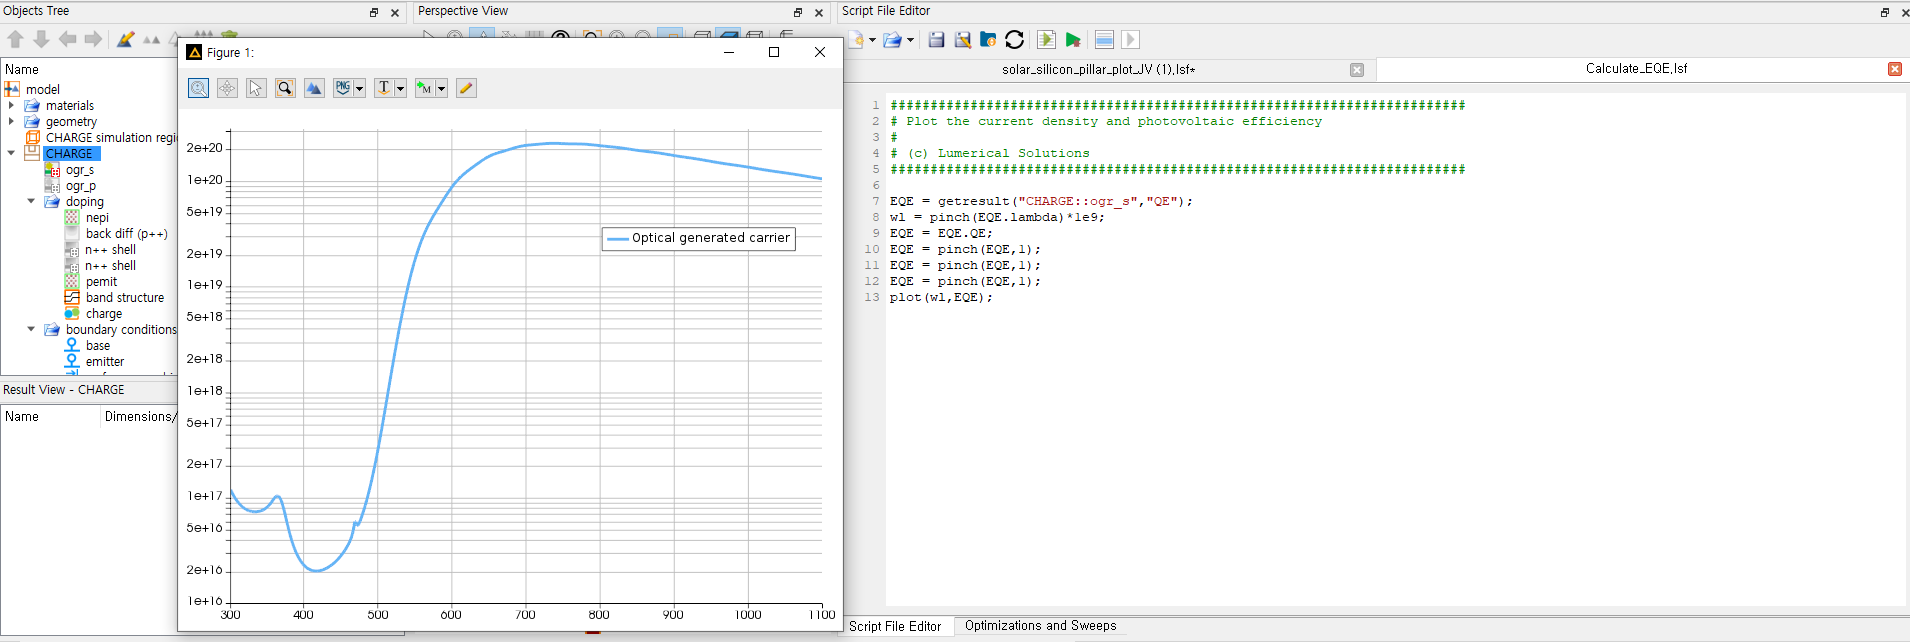
.mat files could not be imported by script. In the script, .mat files are imported by ‘importdataset’ command. But, the script result shows that very low Jsc, and it would might be dark current. It means optical generation rates are not successfully imported.
I’m not sure that my script is optimized.
I put a lot of effort into calculating spectral EQE, but it still hard work for me.
If you have any idea on the script or script codes for calculating EQE, please give me some advice.
The whole codes in this script are shared below:
##########################################################################
# Scriptfile: cis_QE.lsf
#
# Description:
# This file runs a sweep over all generation objects for each angle
# and calculates efficiency and cross talk
#
# Copyright 2012, Lumerical Solutions, Inc.
###########################################################################
start_wl = 300;
end_wl = 304;
npts = end_wl - start_wl + 1;
surface_area = getnamed("CHARGE simulation region","x span")*(getnamed("CHARGE simulation region","y span"));
Jsc = linspace(0,0,npts);
clearjobs;
original_filename = currentfilename;
for (i = start_wl:end_wl) {
select("CHARGE::generation::"+num2str(i));
importdataset(num2str(i)+".mat");
groupscope("::model");
generation_object_name = num2str(i);
groupscope("CHARGE::generation");
selectall;
set("x",0);
set("y",0);
set("z",0);
set("enabled",0);
setnamed(generation_object_name,"enabled",1);
filename = num2str(i);
save(filename);
addjob(currentfilename);
?"Added " + currentfilename;
groupscope("::model");
}
load(original_filename);
?"Running sweep...";
runjobs;
##########################################################################
?"Processing results...";
for (i = 1:npts) {
load(num2str(299+i));
filetag = "wavelength" + num2str(299+i) + "nm";
Jsc(i) = pinch(getdata("CHARGE","emitter.I")/surface_area*0.1);
}
load(original_filename);
print(Jsc);
wl = linspace(start_wl,end_wl,npts);
EQE = (-Jsc*1239.8)/(100*wl);
plot(wl,EQE,"wavelength", "EQE %");
setplot("y min",0);
setplot("y max",1);
legend("");
-
February 6, 2024 at 1:12 am
kghaffari
Ansys EmployeeArpan, your understanding is correct; optical efficiency corresponds to the absorption simulated in FDTD. I recommend having a look at the step 1 description in this article, which includes helpful information regarding optical efficiency calculation: https://optics.ansys.com/hc/en-us/articles/360042358574-CMOS-image-sensor-Angular-response-3D
Handon, great to see the progress you've made in setting up your simulation. Regarding the lower than expected current density reported by CHARGE, I recommend to first troubleshoot the issue without the use of script. When you run the simulation, without and with the import generation object enabled (in the GUI), do you see a difference? If you don't, here are some potential causes:
- The generation object is not placed properly; the object might be outside of the simulation region. Or it is possible that you only have 1 data point in the third direction (e.g. for uniform z); at least two data points are needed for import objects even for the 3rd uniform direction. You can check the import objects for the solar cell example to confirm the format.
- The generation values in the import object are too low to cause a meaningful response in CHARGE. You can check this by visualizing the data and inspecting the range of values shown in the visualizer (max is more important). Try increasing the scaling factor (even to unrealisticly high values) to confirm whether this is the issue. If the values are small it might be caused by the wavelength range being too narrow. Having errors in your updated absorption/generations calculations (in FDTD analysis group) are also a possibility.
If the results are reasonable using the GUI, then ofcourse you would need to prioritize testing the script.
Hope this helps.
Best regards
-
- The topic ‘Calculate EQE in CHARGE’ is closed to new replies.


-
4673
-
1565
-
1386
-
1236
-
1021

© 2025 Copyright ANSYS, Inc. All rights reserved.


